One Developer, 250+ Pull Requests, One Month
Boris Cherny merges over 250 pull requests per month. Not with a team of 20. Not by writing sloppy code. He does it from a single terminal running Claude Code — Anthropic’s AI coding agent that lives in your command line.
That number sounds absurd until you see how he works: five terminal sessions running in parallel, each with Claude Code tackling a different task in an isolated git worktree. Five more web sessions handle research and code review simultaneously. Each session gets its own 200,000-token context window — roughly 150,000 words of working memory. While one session refactors an authentication module, another writes tests, a third builds a dashboard, and two more handle code reviews. The compound effect is staggering.
But here’s what makes this relevant to you: Boris isn’t writing most of that code by hand. He’s directing an AI agent with well-crafted prompts, verifying the output, and shipping. The same workflow that lets him merge 250+ PRs a month can help a supply chain analyst automate their weekly demand reports, build interactive dashboards, or debug R scripts that would otherwise take days to untangle.
Claude Code is the tool that finally makes supply chain data science accessible — even if you’ve never written a line of code. And if you have written code, it can compress hours of repetitive data work into minutes of conversation.
This guide organizes everything you need — from installation to advanced parallel workflows — into three difficulty levels. Start where you’re comfortable, and level up when you’re ready.
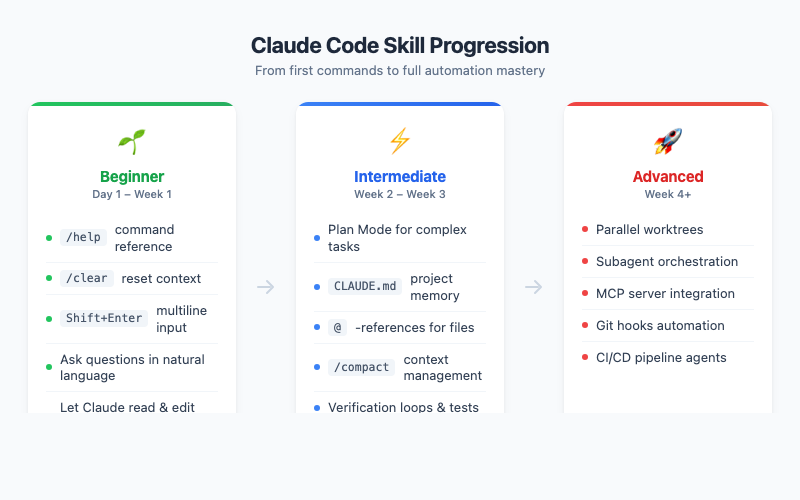
Beginner Level — Your First Week with Claude Code
What Claude Code Actually Is (and Isn’t)
Let’s clear up a common confusion. Claude Code is not a chatbot in your browser. It’s not ChatGPT with a different logo. It’s a full agentic AI that runs inside your terminal — the same terminal where you run git, python, or Rscript. It can read your files, write code, run commands, search your codebase, and execute multi-step tasks autonomously.
Think of it as hiring a very fast, very patient junior developer who never sleeps and has read every Stack Overflow answer ever written. You give it instructions in plain English, it reads your code, proposes changes, and — with your permission — makes them.
The key differences from browser-based AI:
| Feature | Claude.ai (Browser) | Claude Code (Terminal) |
|---|---|---|
| Reads your local files | No | Yes |
| Edits your code directly | No | Yes |
| Runs shell commands | No | Yes |
| Manages git workflows | No | Yes |
| Context window | 200k tokens | 200k tokens |
| Best for | Research, writing, chat | Coding, automation, analysis |
Installation: 60 Seconds to Your First Session
Open your terminal and run:
curl -fsSL https://claude.ai/install.sh | bash
That’s it. One line. No Docker, no virtual environments, no configuration files. On macOS you can also use brew install --cask claude-code. Then launch Claude Code by typing:
claude
You’ll authenticate with your Anthropic account on first launch, and you’re in. A blinking cursor awaits your first instruction.
Your First Five Commands
Don’t overthink this. Start simple:
1. Ask a question:
What files are in the current directory?
Claude Code will list your files. It’s the world’s most overqualified ls command, but it’ll also explain what it finds.
2. Read and explain a file:
Read the file data/procurement_q1.csv and tell me what it contains
This is where it gets useful fast. Claude Code doesn’t just dump the contents — it analyzes the structure, identifies column types, flags potential data quality issues, and suggests what analyses you could run.
3. Get help:
/help
Lists all available slash commands. Bookmark this mentally — you’ll use /help more than you think for the first few days.
4. Clear the conversation:
/clear
Starts fresh. Use this when you’re switching topics or when Claude Code seems confused. It’s the equivalent of closing and reopening a browser tab.
5. Ask for something useful:
Write an R script that reads procurement_q1.csv, calculates spend by supplier, and creates a Pareto chart
This is the moment when things click. Claude Code will write the R script, explain what it does, and — if you allow it — save the file and even run it. What used to take an hour of Googling and Stack Overflow copy-pasting now takes 30 seconds.
Terminal Setup: Small Config, Big Difference
Claude Code works in any terminal, but a quick setup makes the experience dramatically better.
The Shift+Enter problem: In most terminals, pressing Enter sends your message immediately. That’s fine for one-liners, but when you want to write multi-line prompts (and you will), you need Shift+Enter for newlines. iTerm2, WezTerm, Ghostty, and Kitty support this natively. For other terminals:
/terminal-setup
This configures your terminal to handle multi-line input properly.
Enable notifications so you know when a long-running task finishes. In iTerm2: Settings > Profiles > Terminal > Notification Center Alerts, then filter by "escape sequence." Now you can switch to another tab while Claude Code works, and it’ll ping you when it’s done.
The Supply Chain Quick Win
Here’s a concrete scenario. You have a messy Excel export of purchase orders — inconsistent date formats, supplier names with typos, missing unit prices. Normally this is a 2-hour cleanup job. With Claude Code:
Read data/PO_export_march.xlsx and clean it up:
- Standardize date columns to YYYY-MM-DD
- Fuzzy-match supplier names and consolidate duplicates
- Flag rows with missing unit prices
- Save as cleaned_PO_march.csv
Claude Code will write a Python or R script to do exactly this, explain each transformation, and execute it. Your 2-hour cleanup job becomes a 5-minute conversation — most of which is reviewing the output.
Intermediate Level — Becoming Productive
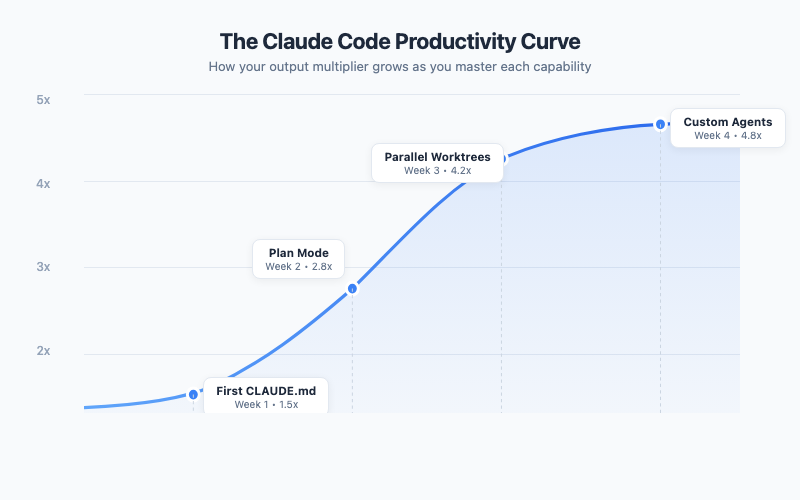
This is where you stop using Claude Code as a fancy autocomplete and start using it as an actual workflow partner. The productivity difference between Beginner and Intermediate is easily 3-5x.
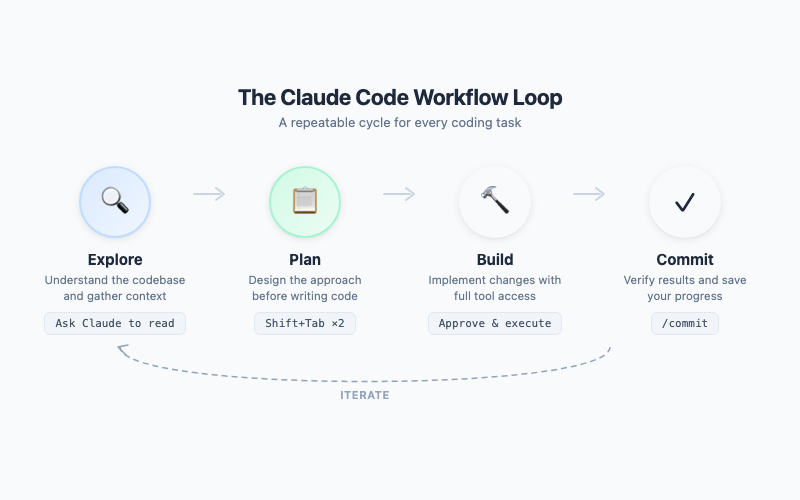
The Golden Workflow: Explore, Plan, Build, Commit
Every effective Claude Code session follows this four-step cycle. It’s simple enough to memorize and powerful enough to handle any task.
Step 1 — Explore. Before Claude Code writes a single line, it needs to understand the landscape. Ask it to read relevant files, understand the codebase structure, and identify patterns. Good exploration prompts:
Read the files in src/inventory/ and explain the architecture
What forecasting methods are currently implemented in this project?
Step 2 — Plan. Press Shift+Tab twice to enter Plan Mode. (One press activates Auto-Accept mode — the opposite of what you want here.) In Plan Mode, Claude Code proposes an implementation plan but doesn’t execute anything. You review, adjust, and approve before a single file is touched. This is critical for non-trivial tasks — it prevents Claude Code from charging off in the wrong direction.
In Plan Mode, Claude Code will:
- Identify which files need to change
- Describe each change before making it
- Flag potential risks or trade-offs
- Wait for your approval
Press Shift+Tab twice again to iterate on the plan. When you’re satisfied, approve it, and Claude Code executes the entire plan in one shot.
Step 3 — Build. Claude Code makes the changes. If you’ve set up verification (more on that below), it automatically runs tests after each change to catch regressions immediately.
Step 4 — Commit. Claude Code can create git commits with meaningful messages, push branches, and even open pull requests. The entire cycle — explore, plan, build, commit — can happen in a single session.
Your First CLAUDE.md: The Project Brain
This is the single most important intermediate skill. A CLAUDE.md file at the root of your project is a persistent instruction file that Claude Code reads at the start of every session. It’s your project’s brain — the institutional knowledge that makes Claude Code productive from the first prompt instead of requiring 10 minutes of context-setting.
Here’s what a good CLAUDE.md looks like for a supply chain analytics project:
# CLAUDE.md

## Project
Supply chain demand forecasting using R. Data in data/, scripts in src/, outputs in reports/.

## Commands
- Run tests: Rscript tests/run_all.R
- Generate report: Rscript src/weekly_report.R
- Lint R code: lintr::lint_dir("src/")

## Conventions
- Use tidyverse style (pipes, tibbles, snake_case)
- All date columns: YYYY-MM-DD format
- ggplot theme: theme_minimal() with base_size = 13
- Save plots at 800x500px, white background

## IMPORTANT
- Never overwrite raw data files in data/raw/
- Always validate forecasts against the holdout set before reporting accuracy
Key principles for CLAUDE.md:
- Keep it short. Under 200 lines. Claude Code reads this every session — bloated instructions waste context.
- Be specific. "Use tidyverse style" is better than "Follow R best practices."
- Include commands. Claude Code can run your tests, linters, and builds if you tell it how.
- Use IMPORTANT for critical rules. Claude Code pays extra attention to lines marked this way.
Run /init to have Claude Code generate a starter CLAUDE.md by analyzing your project. Then refine it yourself.
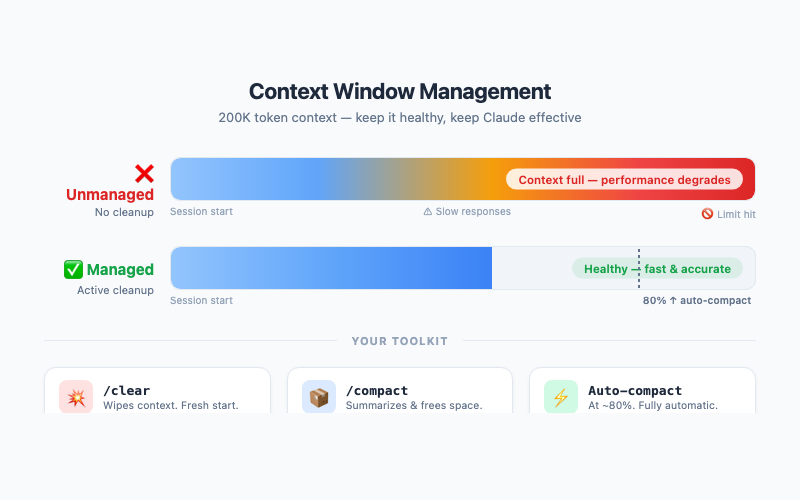
Context Management: The 200k Skill
Claude Code has a 200,000-token context window — enormous, but not infinite. Long sessions accumulate context, and eventually the window fills up. When that happens, performance degrades: Claude Code loses track of earlier decisions, repeats itself, or forgets file contents.
Two essential tools:
/compact — Compresses the conversation history, keeping key decisions and outcomes while discarding the verbose middle. Use this proactively when you notice the conversation getting long, before performance degrades. It’s like taking concise meeting notes and starting from the summary.
/clear — Nuclear option. Wipes the entire context and starts fresh. Use this when switching to a completely different task, or when /compact isn’t enough.
The intermediate trick: one task, one session. Don’t ask Claude Code to refactor your forecasting module, then debug an unrelated data loader, then write documentation — all in one session. Each topic accumulates context, and by the third task you’re deep in the window with conflicting contexts. Start a new session for each distinct task.
The @-Reference Power Move
Instead of describing files, reference them directly:
Look at @src/forecast.R and @src/inventory.R — refactor the shared helper functions into a new @src/utils.R
The @ syntax tells Claude Code exactly which files you mean. No ambiguity, no wasted context searching for the right files. You can also reference URLs:
Implement the algorithm described at @https://otexts.com/fpp3/ets.html
Verification Loops: Trust but Verify
This is Boris Cherny’s number one tip, and he says it delivers "2-3x the quality of the final result." The idea is simple: tell Claude Code to verify its own work.
After making changes, run Rscript tests/run_all.R and fix any failures
Implement the new forecasting method, then prove to me it works by running it on the test dataset and showing the MAPE
Even more powerful: challenge Claude Code to find flaws in its own work:
Grill me on these changes. What could go wrong? What edge cases did we miss?
This adversarial verification catches bugs that a simple "write the code" prompt would miss. The code isn’t just generated — it’s stress-tested before you ever review it.
Piping Data Directly
For quick analysis, pipe data straight into Claude Code from the command line:
cat data/demand_forecast.csv | claude "Analyze this demand data. Identify seasonality, trend, and any anomalies. Suggest the best forecasting method."
Rscript src/model_comparison.R 2>&1 | claude "These are the results of 5 forecasting models. Which one should we deploy and why?"
This turns Claude Code into a command-line analyst that takes raw data or output and returns structured insights. Combined with cron jobs or scheduled scripts, you can build automated analysis pipelines.
Session Management: Pick Up Where You Left Off
Two flags that change everything:
--continue— Resumes the most recent session. You closed the terminal, went to lunch, and came back?claude --continuepicks up exactly where you left off.--resume— Shows a list of recent sessions and lets you choose which to resume.
Also useful: /rename "Demand Forecasting Refactor" gives your session a meaningful name so you can find it later.
Advanced Level — 10x Productivity
Fair warning: this section gets more technical. The Beginner and Intermediate levels are useful for anyone — supply chain analyst, operations manager, or occasional scripter. The Advanced level assumes you’re comfortable with git, terminal workflows, and JSON configuration files. If that’s not you yet, bookmark this section and come back when Intermediate feels easy.
This is where Boris’s 250-PRs-per-month workflow lives. The techniques here compound on everything from Beginner and Intermediate. Individually, each one adds 20-30% efficiency. Together, they multiply.
Parallel Sessions with Git Worktrees
This is Boris’s secret weapon. Instead of working on one task at a time, he runs 5+ Claude Code sessions simultaneously, each in its own git worktree — an isolated copy of the repository with its own branch.
# Create a worktree for each task
git worktree add ../forecast-refactor -b feature/forecast-refactor
git worktree add ../dashboard-update -b feature/dashboard-update
git worktree add ../data-pipeline -b feature/data-pipeline
Now open a terminal in each worktree and launch claude. Each session has its own 200k-token context window, its own branch, and its own working directory. They can’t interfere with each other. While one session refactors your forecasting code, another builds a dashboard, and a third restructures your data pipeline.
Running five parallel sessions won’t give you a clean 15x multiplier — review overhead and merge resolution are real — but the throughput gains are dramatic enough that Boris Cherny ships 250+ PRs a month.
The key insight: your bottleneck shifts from writing code to reviewing code. You become a technical director — setting direction, reviewing output, and merging results — rather than an individual contributor hunched over a keyboard.
Custom Subagents: Your AI Team
Subagents are Claude Code sessions that run inside your main session. Each gets its own isolated 200k-token context window, works autonomously, and returns only a summary to the parent session. Think of them as specialist consultants you bring in for specific tasks.
Define custom subagents in .claude/agents/:
# .claude/agents/forecast-validator.md

You are a supply chain forecast validation specialist.

## Your Mission
Validate demand forecasts by:
1. Running backtests against holdout data
2. Computing accuracy metrics (MAPE, RMSE, bias)
3. Checking for common errors (data leakage, overfitting, seasonal misalignment)
4. Comparing against naive benchmarks

## Rules
- Always compute accuracy on the HOLDOUT set, never the training set
- Flag any forecast with MAPE > 30% for manual review
- Include a confidence interval assessment
Now you can invoke this specialist any time:
Use the forecast-validator agent to check the new ETS model in src/forecast_ets.R
The subagent reads the code, runs the validation, and reports back with findings. Your main context window stays clean.
Boris’s personal subagent toolkit includes a code-simplifier (reduces complexity), a build-validator (ensures everything compiles), a verify-app (runs end-to-end tests), and a code-architect (reviews design patterns). Each one eliminates a category of bugs without cluttering the main session.
Skills and Slash Commands: One-Key Workflows
Skills are reusable prompts stored in .claude/skills/ that you invoke with slash commands. They turn multi-step workflows into one-liners.
Create .claude/skills/weekly-forecast.md:
---
name: weekly-forecast
description: Generate this week's demand forecast report
---

1. Read the latest demand data from data/demand_latest.csv
2. Run the ETS forecast model in src/forecast_ets.R
3. Compare against the moving average baseline
4. Generate the accuracy comparison table
5. Create the executive summary chart
6. Save the report as reports/forecast_YYYY-MM-DD.html
Now every Monday morning:
/weekly-forecast
One command. Full report. No manual steps, no forgotten procedures. Your weekly reporting workflow becomes as simple as pressing Enter.
Hooks: Automated Quality Gates
Hooks are shell commands that run automatically at specific points in Claude Code’s workflow. They’re deterministic — they fire every time, without Claude Code having to remember.
Common use cases:
- Auto-format code after every edit (no more style inconsistencies)
- Run linting before every commit
- Execute tests after every file modification
Boris uses a PostToolUse hook that auto-formats code after any edit:
{
  "hooks": {
    "PostToolUse": [
      {
        "matcher": "Edit|Write",
        "hooks": [
          {
            "type": "command",
            "command": "Rscript -e 'styler::style_file(\"$CLAUDE_FILE\")' || true"
          }
        ]
      }
    ]
  }
}
Every time Claude Code writes or edits a file, it automatically gets formatted. No manual step, no forgotten formatting, no messy diffs in code review.
MCP Servers: Claude Code Meets Your Stack
Model Context Protocol (MCP) servers connect Claude Code to external tools — Slack, databases, monitoring systems, and more. Configure them in .mcp.json:
{
  "mcpServers": {
    "postgres": {
      "command": "mcp-server-postgres",
      "args": ["postgresql://user:pass@localhost/supply_chain_db"]
    },
    "slack": {
      "command": "mcp-server-slack",
      "env": { "SLACK_TOKEN": "xoxb-..." }
    }
  }
}
Now Claude Code can query your database directly:
Query the supply_chain_db for all purchase orders from Q1 where the supplier lead time exceeded the contracted SLA. Summarize the results and post a report to the #procurement-alerts Slack channel.
One prompt. Database query. Analysis. Slack notification. What used to be a multi-tool, multi-tab, multi-hour process is now a single sentence.
Non-Interactive Mode: CI/CD Pipelines
Claude Code doesn’t require a human at the keyboard. The -p flag runs it non-interactively:
claude -p "Read src/forecast.R and add input validation for the date parameters. Run the tests afterward." --output-format json
This opens up automation possibilities that go far beyond interactive coding:
- Nightly data validation: Cron job that pipes new data into Claude Code, asks it to check for anomalies, and emails a report
- Pre-commit review: Git hook that sends changed files to Claude Code for a quick review before committing
- Fan-out migrations: When you need to update 50 configuration files with the same pattern, use a script that launches a Claude Code instance for each one in parallel
# Fan-out: update all forecast config files in parallel
for config in configs/forecast_*.yaml; do
  claude -p "Update $config to use the new API endpoint format" &
done
wait
Permissions and Sandboxing: Safe Automation
When running Claude Code with more autonomy, security matters. Two critical tools:
/permissions — Opens a viewer that shows which tools Claude Code is allowed to use without asking. You can review and manage permissions interactively. To pre-configure allowlists, add them to .claude/settings.json:
{
  "permissions": {
    "allowedTools": [
      "Bash(git add:*)",
      "Bash(git commit:*)",
      "Bash(git push:*)",
      "Bash(Rscript:*)"
    ]
  }
}
This lets Claude Code run git and Rscript commands without prompting you each time — while still blocking everything else.
/sandbox — Enables OS-level sandboxing that prevents Claude Code from accessing files or network resources outside the project directory. This is essential for CI/CD pipelines where Claude Code runs unattended.
Boris specifically recommends /permissions over the --dangerously-skip-permissions flag. The allowlist approach gives you speed without sacrificing safety.
Where It Breaks: Honest Limitations
No tool review is complete without discussing where it falls short. Claude Code is powerful, but it has real limitations:
The kitchen sink trap. The most common failure mode is cramming too many unrelated tasks into one session. Each topic eats context, and by the fifth task the AI is juggling too many threads. The fix: one task per session, use /compact proactively, and start new sessions early rather than late.
The trust-then-verify gap. Claude Code generates confident-sounding code that is usually correct — but "usually" isn’t always. Without verification loops (tests, manual review, backtests), bugs slip through. The fix: always include verification in your prompts.
The over-specified CLAUDE.md. A 500-line CLAUDE.md with every edge case documented sounds thorough. In practice, it wastes context tokens and confuses priorities. The fix: keep CLAUDE.md under 200 lines, use IMPORTANT sparingly, and prune ruthlessly.
Infinite exploration. Claude Code can spend its entire context window exploring your codebase without ever making a change. The fix: set clear boundaries. "Read only these 3 files" is better than "Understand the entire project."
Complex multi-file refactors. While Claude Code handles individual file changes brilliantly, large-scale refactors across dozens of files can produce inconsistent results. The fix: break large refactors into smaller, testable chunks and use parallel worktrees.
The Supply Chain Professional’s Playbook
Everything above applies to any developer. But here’s why this tool is particularly transformative for supply chain and operations management — a field drowning in data but chronically short on data engineering talent.
MRP parameter auditing at scale. Export your item master from SAP, Oracle, or Business Central. Pipe the CSV into Claude Code and ask: "Flag every item where the safety stock covers less than 1x the lead time demand, and every item where the reorder point hasn’t been updated in over 12 months." What used to require a consultant engagement and weeks of analysis becomes a 15-minute conversation with actionable output — a prioritized list of parameter misalignments ranked by inventory cost impact.
Demand sensing from unstructured signals. Connect Claude Code to your Slack workspace via MCP, and ask it to scan procurement and sales channels for mentions of supply disruptions, customer complaints, or unusual order patterns. It can synthesize those signals into a daily briefing that your planning team reviews every morning — a lightweight demand sensing layer that costs nothing but an MCP configuration.
Supplier performance dashboards from raw ERP data. Describe the KPIs you need — on-time delivery rate, quality rejection rate, lead time variability by supplier — and Claude Code builds the full analytics pipeline: data extraction query, R transformation script, ggplot visualizations, and a self-contained HTML dashboard. The interactive dashboard for this post was built exactly this way.
S&OP report automation. Monthly sales and operations planning reports follow the same structure every cycle — demand vs. forecast accuracy, inventory turns by product family, capacity utilization, and exception flags. Package the entire report generation as a Claude Code skill: one slash command pulls the data, runs the analysis, generates the charts, and saves the executive summary. Your team spends time interpreting the report instead of building it.
Shared team conventions via CLAUDE.md. Your supply chain analytics team has conventions — date formats, standard KPI definitions, approved data sources, naming rules for planning parameters. Encode these in a shared CLAUDE.md checked into your team’s repository. Every team member’s Claude Code session automatically follows the same rules, producing consistent output regardless of who runs the analysis.
Interactive Dashboard
Explore the full command reference yourself — search commands, filter by difficulty level, and build your own quick-reference cards.
Interactive Dashboard
Explore the data yourself — adjust parameters and see the results update in real time.
Your Next Steps
You don’t need to absorb all of this at once. The learning curve is real, but every level delivers immediate value. Here’s your week-by-week plan:
-
This afternoon: Install and explore. Run
curl -fsSL https://claude.ai/install.sh | bash, launch it in a project directory, and ask it to explain a file you’re working with. Get comfortable with the conversational interface. Use/helpwhen you’re stuck. -
This week: Write your CLAUDE.md. This is the single highest-leverage action for intermediate productivity. Document your project commands, conventions, and critical rules in a
CLAUDE.mdfile at your project root. Run/initfor a starter template, then customize it. -
Next week: Master Plan Mode. Practice the Explore-Plan-Build-Commit cycle with Shift+Tab twice on a real task. Start with something low-risk — a code cleanup, a new utility function, a test suite. Notice how plan-then-execute produces better results than stream-of-consciousness prompting.
-
Week three: Build your first skill. Take a repetitive workflow (weekly report, data validation, forecast update) and package it as a skill in
.claude/skills/. The time investment is 10 minutes. The time saved per execution is 30+ minutes, forever. -
Week four: Go parallel. Create your first git worktree, run two Claude Code sessions simultaneously, and experience the multiplicative productivity gain firsthand. Once you feel the speed of parallel sessions, you’ll never go back to single-threaded work.
Show R Code
# =============================================================================
# Supply Chain Quick-Start: Demand Analysis with Claude Code
# =============================================================================
# This is the kind of analysis you can ask Claude Code to generate
# in under 60 seconds. Try it yourself:
#
#   "Read my demand data and create a Pareto chart of spend by supplier,
#    a demand trend with forecast, and an ABC classification summary."
#
# Required: ggplot2, dplyr, scales
# =============================================================================

library(ggplot2)
library(dplyr)
library(scales)

set.seed(42)

# --- Custom theme (Claude Code would generate this from your CLAUDE.md) ---
theme_scm <- theme_minimal(base_size = 13) +
  theme(
    plot.title = element_text(face = "bold", size = 14),
    plot.subtitle = element_text(color = "grey40", size = 11),
    panel.grid.minor = element_blank(),
    legend.position = "bottom"
  )

# --- Color palette ---
col_a <- "#e74c3c"   # A-class (high value)
col_b <- "#e67e22"   # B-class (medium)
col_c <- "#27ae60"   # C-class (low value)
col_primary <- "#2980b9"

# =============================================================================
# SAMPLE DATA — Replace with your own!
# =============================================================================
# 12 months of weekly demand for a distribution center
# In practice, you'd load this from CSV:
#   demand <- read.csv("data/demand_weekly.csv")

weeks <- seq(as.Date("2025-01-06"), as.Date("2025-12-29"), by = "week")
n_weeks <- length(weeks)

demand <- data.frame(
  week = weeks,
  demand = round(
    500 +                                    # base demand
    seq(0, 80, length.out = n_weeks) +       # upward trend
    60 * sin(2 * pi * (1:n_weeks) / 52) +    # annual seasonality
    rnorm(n_weeks, 0, 30),                   # random noise
    0
  )
)

# Supplier spend data (typical procurement export)
suppliers <- data.frame(
  supplier = paste0("Supplier_", LETTERS[1:15]),
  annual_spend = c(
    450000, 320000, 280000, 180000, 120000,
    95000, 72000, 55000, 38000, 25000,
    18000, 12000, 8000, 5000, 3000
  )
)

# =============================================================================
# CHART 1: Supplier Pareto Analysis (ABC Classification)
# =============================================================================

pareto <- suppliers %>%
  arrange(desc(annual_spend)) %>%
  mutate(
    cumulative_spend = cumsum(annual_spend),
    cumulative_pct = cumulative_spend / sum(annual_spend) * 100,
    abc_class = case_when(
      cumulative_pct <= 80 ~ "A",
      cumulative_pct <= 95 ~ "B",
      TRUE ~ "C"
    ),
    supplier = factor(supplier, levels = supplier)
  )

ggplot(pareto, aes(x = supplier, y = annual_spend / 1000)) +
  geom_col(aes(fill = abc_class), width = 0.7) +
  geom_line(
    aes(y = cumulative_pct * max(annual_spend) / 100000, group = 1),
    color = "grey30", linewidth = 0.8
  ) +
  geom_point(
    aes(y = cumulative_pct * max(annual_spend) / 100000),
    color = "grey30", size = 2
  ) +
  geom_hline(
    yintercept = 80 * max(pareto$annual_spend) / 100000,
    linetype = "dashed", color = col_a, alpha = 0.5
  ) +
  annotate("text",
    x = 14, y = 80 * max(pareto$annual_spend) / 100000 + 15,
    label = "80% threshold", color = col_a, size = 3, fontface = "italic"
  ) +
  scale_fill_manual(
    values = c("A" = col_a, "B" = col_b, "C" = col_c),
    name = "ABC Class"
  ) +
  scale_y_continuous(
    labels = dollar_format(prefix = "$", suffix = "k"),
    sec.axis = sec_axis(~ . * 100000 / max(pareto$annual_spend),
                        name = "Cumulative %",
                        labels = function(x) paste0(round(x), "%"))
  ) +
  labs(
    title = "Supplier Spend Pareto Analysis",
    subtitle = "ABC classification — 4 suppliers account for 80% of total spend",
    x = NULL, y = "Annual Spend"
  ) +
  theme_scm +
  theme(axis.text.x = element_text(angle = 45, hjust = 1, size = 10))

# ggsave("Images/pareto_analysis.png", width = 8, height = 5,
#        dpi = 100, bg = "white")

# =============================================================================
# CHART 2: Demand Trend with Simple Moving Average Forecast
# =============================================================================

# 4-week moving average
demand <- demand %>%
  mutate(
    ma_4 = zoo::rollmean(demand, k = 4, fill = NA, align = "right")
  )

# Simple forecast: extend the moving average 8 weeks ahead
last_ma <- tail(na.omit(demand$ma_4), 1)
last_trend <- mean(diff(tail(na.omit(demand$ma_4), 8)))

forecast_weeks <- seq(max(demand$week) + 7, by = "week", length.out = 8)
forecast_df <- data.frame(
  week = forecast_weeks,
  forecast = last_ma + last_trend * (1:8),
  lower = last_ma + last_trend * (1:8) - 1.96 * sd(demand$demand - demand$ma_4,
                                                      na.rm = TRUE),
  upper = last_ma + last_trend * (1:8) + 1.96 * sd(demand$demand - demand$ma_4,
                                                      na.rm = TRUE)
)

ggplot() +
  # Forecast confidence interval
  geom_ribbon(
    data = forecast_df,
    aes(x = week, ymin = lower, ymax = upper),
    fill = col_primary, alpha = 0.15
  ) +
  # Actual demand
  geom_line(
    data = demand,
    aes(x = week, y = demand),
    color = "grey60", linewidth = 0.5
  ) +
  geom_point(
    data = demand,
    aes(x = week, y = demand),
    color = "grey60", size = 1
  ) +
  # Moving average
  geom_line(
    data = demand,
    aes(x = week, y = ma_4),
    color = col_primary, linewidth = 1
  ) +
  # Forecast line
  geom_line(
    data = forecast_df,
    aes(x = week, y = forecast),
    color = col_a, linewidth = 1, linetype = "dashed"
  ) +
  scale_y_continuous(labels = comma_format()) +
  labs(
    title = "Weekly Demand: Trend + 8-Week Forecast",
    subtitle = "Blue = 4-week moving average | Red dashed = forecast with 95% CI",
    x = NULL, y = "Units Demanded"
  ) +
  theme_scm

# ggsave("Images/demand_forecast.png", width = 8, height = 5,
#        dpi = 100, bg = "white")

# =============================================================================
# SUMMARY TABLE: ABC Classification Results
# =============================================================================

abc_summary <- pareto %>%
  group_by(abc_class) %>%
  summarise(
    n_suppliers = n(),
    total_spend = sum(annual_spend),
    pct_of_spend = sum(annual_spend) / sum(suppliers$annual_spend) * 100,
    .groups = "drop"
  ) %>%
  mutate(
    pct_of_suppliers = n_suppliers / nrow(suppliers) * 100,
    recommendation = case_when(
      abc_class == "A" ~ "Strategic partnerships, quarterly reviews",
      abc_class == "B" ~ "Regular monitoring, annual contracts",
      abc_class == "C" ~ "Simplify ordering, consider consolidation"
    )
  )

cat("\n=== ABC Classification Summary ===\n")
print(abc_summary)

# =============================================================================
# APPLY TO YOUR OWN DATA
# =============================================================================
# Replace the sample data above with your own:
#
# demand <- read.csv("your_demand_data.csv")       # columns: week, demand
# suppliers <- read.csv("your_supplier_spend.csv")  # columns: supplier, annual_spend
#
# Or ask Claude Code:
#   "Read data/procurement_q1.csv and run this ABC analysis on it.
#    Adjust the column names to match my data."
#
# Claude Code will adapt the script to your specific file format,
# column names, and business rules — no manual editing needed.
# =============================================================================
References
-
Cherny, B. (2025). "The Boris Way: Claude Code Best Practices." Grit AI Studio Guides. guides.gritai.studio.
-
Cherny, B. (2025). "How Boris Uses Claude Code." howborisusesclaudecode.com.
-
Anthropic. (2025). "Claude Code Documentation." code.claude.com.
-
Anthropic. (2025). "Claude Code: Best Practices for Agentic Coding." anthropic.com/engineering/claude-code-best-practices.
-
McConnell, S. (2004). Code Complete: A Practical Handbook of Software Construction. 2nd ed. Microsoft Press.
-
Forsgren, N., Humble, J., & Kim, G. (2018). Accelerate: The Science of Lean Software and DevOps. IT Revolution Press.
Schreibe einen Kommentar