Here’s something I did last week that I can’t stop thinking about: I took 10 of the largest Fortune 500 companies and scored them as if they were suppliers in my portfolio.
Not hypothetical suppliers. Not “Company A” and “Company B” dressed up in fake data. I mean Walmart, Amazon, Apple, ExxonMobil — real companies, real financials from their FY2025 SEC filings, real ESG ratings from MSCI and Sustainalytics, real credit ratings from S&P. Five risk dimensions. One composite score. Ten of the most powerful corporations on Earth, judged not by their stock price but by whether I’d sleep well at night depending on them for a critical component.
The results were… not what Wall Street would tell you.
The company with the best financial metrics — AA- credit, $28.8 billion in net income, rock-solid balance sheet — scored as the riskiest supplier on the entire list. Meanwhile, the company you buy cough drops from landed at number two, ahead of Apple, Amazon, and Alphabet. And the company Wall Street finds most boring — a sprawling conglomerate run by a 95-year-old who eats McDonald’s for breakfast — scored as the single safest supplier in the group, despite having the worst ESG score of them all.
If that doesn’t make you rethink how you evaluate suppliers, nothing will.
Why Would You Score Fortune 500 Giants as Suppliers?
Before you dismiss this as a thought experiment, consider: you probably already buy from these companies.
Amazon Web Services hosts your ERP, your planning tools, and maybe your entire IT infrastructure. Apple supplies the devices your workforce uses. ExxonMobil provides the fuel that moves your freight. McKesson distributes the pharmaceuticals your employees get through their health plan. UnitedHealth and Cigna manage your corporate health insurance. Walmart might be your largest customer — and if you’re in CPG, that’s a concentration dependency that keeps CFOs up at night.
These aren’t abstract corporations. They’re nodes in your supply chain. And the question isn’t whether they could disrupt you — it’s whether you’ve ever bothered to quantify how much.
Most procurement teams score their small and mid-tier suppliers rigorously but wave Fortune 500 companies through on reputation alone. “They’re too big to fail” is literally the risk assessment. Which is exactly what people said about Lehman Brothers in August 2008, about Enron in September 2001, and about Silicon Valley Bank in February 2023.
Size is not a risk mitigation strategy. It’s a cognitive bias.
The Framework: Five Dimensions of Supplier Risk
Risk is not one-dimensional. A supplier can be financially indestructible yet operationally fragile. Another might ace every ESG audit but operate in regions where a geopolitical event could sever your supply overnight. Our framework captures this complexity across five dimensions:
| Dimension | Weight | What It Captures | Data Sources |
|---|---|---|---|
| Financial Health | 25% | Probability of financial distress or operational impairment | SEC 10-K filings, credit ratings (S&P/Moody’s), Altman Z-Score |
| Geographic/Geopolitical Risk | 20% | Operational exposure to unstable or disaster-prone regions | World Bank WGI, company 10-K geographic disclosures |
| ESG/Sustainability Risk | 15% | Environmental, social, and governance exposure; litigation risk | MSCI ESG Ratings, Sustainalytics scores, controversy data |
| Market Volatility | 20% | Revenue cyclicality, stock volatility, market sensitivity | Beta coefficients (5Y monthly), revenue trend, credit outlook |
| Concentration/Dependency | 20% | Revenue concentration by segment, customer, or regulatory regime | Company segment reporting (10-K), Herfindahl analysis |
Each dimension is scored on a 1-10 scale (10 = highest risk). The composite score is a weighted average. The weights are adjustable — a pharma company might weight Financial at 35% while a tech company pushes Concentration to 25%. The framework is the same; the calibration is yours.
The Data: Real Numbers from Real Filings
Every number below comes from publicly available sources — primarily FY2025 10-K filings (SEC EDGAR), S&P credit ratings, MSCI ESG research, and Sustainalytics. No proprietary databases. No expensive subscriptions. Just the kind of data any supply chain professional can access.
Financial Snapshot (FY2025)
| Company | Revenue ($B) | Net Margin | Current Ratio | D/E Ratio | Credit Rating | Beta |
|---|---|---|---|---|---|---|
| Amazon | 716.9 | 10.8% | — | Cash > LTD | AA | 1.31 |
| Walmart | 681.0 | 2.9% | 0.78 | — | AA | 0.65 |
| UnitedHealth | 447.6 | 2.7% | — | 0.78 | A+ | 0.75 |
| Apple | 416.2 | 26.9% | 0.97 | 1.03 | AA+ | 1.11 |
| Alphabet | 402.8 | 32.8% | 2.01 | 0.11 | AA+ | 1.16 |
| CVS Health | 402.1 | 0.4% | 0.84 | — | BBB (neg.) | 0.70 |
| Berkshire Hathaway | 371.4 | 18.0% | 1.43 | 0.18 | AA | 0.60 |
| McKesson | 359.1 | 0.9% | — | Neg. equity | BBB+ | 0.60 |
| ExxonMobil | 332.2 | 8.7% | — | — | AA- | 0.38 |
| Cigna | 274.9 | 2.2% | 0.79 | — | A- | 0.65 |
A few things jump out immediately.
CVS Health’s net margin is 0.4%. That’s not a typo. CVS made $1.77 billion in net income on $402 billion in revenue — a margin so thin that a single bad quarter could push it negative. Net income collapsed 62% year-over-year. Combined with a BBB credit rating on negative outlook (just two notches above speculative grade), this is a financial profile that should make procurement teams very nervous about long-term contracts.
McKesson has negative shareholders’ equity. The pharmaceutical distributor has bought back so much stock that its equity has gone negative (-$2.1 billion) — a balance sheet artifact that makes traditional financial ratios (including the Altman Z-Score) produce nonsensical results. McKesson’s BBB+ credit rating and $359 billion in stable revenue tell a different story than its balance sheet. But the razor-thin 0.9% margin means there’s virtually no cushion if something goes wrong.
Alphabet and Apple have the strongest credit profiles — both AA+ with robust margins (32.8% and 26.9% respectively). On pure financials, these are the safest companies on the list. But as we’ll see, financials are only one dimension of supplier risk.
Dimension 1: Financial Risk (25%)
We score financial risk using net profit margin, current ratio, debt-to-equity, credit rating, and where applicable the Altman Z-Score. For companies like Berkshire Hathaway (insurance conglomerate) and McKesson (negative equity), we apply sector-specific adjustments.
| Company | Score | Key Drivers |
|---|---|---|
| Alphabet | 1 | 32.8% margin, AA+ credit, D/E 0.11, current ratio 2.01 |
| Berkshire Hathaway | 1 | 18% margin, AA credit, approximately $373B in cash and short-term investments, D/E 0.18, current ratio 1.43 |
| Apple | 2 | 26.9% margin, AA+ credit, D/E 1.03, current ratio 0.97 |
| Amazon | 3 | 10.8% margin, AA credit, cash exceeds long-term debt |
| Walmart | 4 | Thin margin (2.9%), but AA credit, Z-Score 6.93 |
| ExxonMobil | 4 | Moderate margin (8.7%), AA- credit, revenue declining 5% |
| Cigna | 5 | Thin margin (2.2%), current ratio 0.79, A- credit |
| UnitedHealth | 6 | Margin 2.7%, net income declining 16%, AM Best downgrade |
| McKesson | 7 | 0.9% margin, negative equity (-$2.1B), BBB+ credit |
| CVS Health | 8 | 0.4% margin, net income collapsed 62%, BBB negative outlook |
The contrast between Alphabet (score: 1) and CVS Health (score: 8) is striking. Both are Fortune 500 companies. Both generate over $400 billion in revenue. But Alphabet has an 80x higher profit margin, a credit rating four notches better, and growing earnings — while CVS is teetering on the edge of financial distress.
Dimension 2: Geographic/Geopolitical Risk (20%)
Here’s where we move beyond the balance sheet. A company’s headquarters tells you almost nothing about its geographic risk — what matters is where it operates, where it manufactures, and where it sources.
| Company | Score | Key Exposure |
|---|---|---|
| Apple | 8 | 80-90% of manufacturing in China (Foxconn, Pegatron, Luxshare), TSMC dependency in Taiwan |
| ExxonMobil | 7 | Operations in Middle East, West Africa (Nigeria), Guyana, politically volatile resource regions |
| Walmart | 5 | Operations in 19 countries including Mexico, India, China, South Africa |
| Amazon | 4 | Global AWS + logistics footprint, but services-based (less physical disruption risk) |
| Alphabet | 4 | Global but services-based; data sovereignty/regulatory risk in EU and Asia |
| Berkshire Hathaway | 3 | Diversified globally through subsidiaries, but mainly US and developed markets |
| Cigna | 3 | Primarily US, some international health insurance (Cigna Global) |
| UnitedHealth | 2 | 90%+ US-based healthcare services, some Brazil (Amil) |
| CVS Health | 2 | Almost entirely US-focused domestic operations |
| McKesson | 2 | Primarily US, Canada, and some Europe |
Apple’s geographic score of 8 is the highest in the group — and it’s not even close among the tech companies. Despite being headquartered in Cupertino, Apple’s manufacturing is overwhelmingly concentrated in China (80-90% of final assembly through Foxconn, Pegatron, and Luxshare) and Taiwan (TSMC for chips). In their own 10-K risk factors, Apple acknowledges this dependency explicitly. A Taiwan Strait crisis — which the U.S. Department of Defense identifies as a realistic scenario — would halt production of the world’s most popular smartphone.
The domestic healthcare companies (CVS, UnitedHealth, McKesson) all score 2 — their geographic risk is essentially US sovereign risk, which is about as low as it gets.
Dimension 3: ESG/Sustainability Risk (15%)
ESG risk isn’t about virtue signaling — it’s about litigation exposure, regulatory risk, and supply chain disruption from climate events and social controversies. We use MSCI ESG Ratings and Sustainalytics scores as primary inputs, supplemented by controversy data.
| Company | MSCI ESG | Sustainalytics | Score | Key Risk Factors |
|---|---|---|---|---|
| ExxonMobil | BBB | 43.7 (Severe) | 9 | Climate litigation, Scope 3 emissions, greenwashing allegations |
| Berkshire Hathaway | BB | — | 8 | Minimal ESG disclosure, fossil fuel holdings, lowest-tier Average |
| Amazon | BBB | 25.0 (Medium) | 6 | Warehouse worker safety, antitrust scrutiny |
| UnitedHealth | BBB | — | 6 | Healthcare access concerns, CEO assassination (Dec 2024) |
| Walmart | BBB | 25.3 (Medium) | 5 | Labor practice controversies, environmental footprint |
| Apple | BBB | — | 5 | Supply chain labor (Foxconn), e-waste, but strong carbon targets |
| Cigna | BBB | — | 5 | Healthcare affordability concerns, PBM transparency |
| McKesson | A | — | 5 | Above-average ESG management, but opioid distribution history |
| Alphabet | BBB | — | 5 | MSCI Average; previously claimed carbon neutrality but dropped it in 2024; antitrust + privacy concerns |
| CVS Health | A | 18.7 (Low) | 4 | Above-average ESG per MSCI, Sustainalytics Low risk, opioid settled |
ExxonMobil’s ESG score of 9 is a flashing red alarm. While MSCI rates ExxonMobil BBB (Average), Sustainalytics gives it a 43.7 — classified as Severe Risk, the worst category. The company faces multiple ongoing climate-related lawsuits, and its core business is fundamentally misaligned with the global energy transition. For procurement teams, this isn’t about environmental activism; it’s about regulatory risk. The EU Carbon Border Adjustment Mechanism (CBAM), SEC climate disclosure rules, and escalating carbon pricing create direct cost exposure for any company heavily dependent on ExxonMobil products.
Berkshire Hathaway’s ESG score of 8 is the surprise of the analysis. The safest company on almost every other dimension scores among the worst on ESG. Why? MSCI rates Berkshire Hathaway BB — the lowest tier of their Average band — because Warren Buffett has been openly skeptical of ESG reporting and the company provides minimal sustainability disclosure. Add fossil fuel holdings (Berkshire Hathaway Energy has significant coal and natural gas assets) and you get a company that ESG-focused procurement policies would flag immediately, despite being financially bulletproof.
Dimension 4: Market Volatility (20%)
Market volatility captures how stable and predictable a supplier is as a long-term business partner. A supplier with wildly fluctuating earnings is more likely to cut capacity, restructure, or exit product lines.
| Company | Beta | Score | Key Drivers |
|---|---|---|---|
| Berkshire Hathaway | 0.60 | 1 | ~$373B cash and short-term investments, Aa2 Moody’s credit, diversified |
| Walmart | 0.65 | 2 | Defensive retail, stable +5% growth, fortress AA credit |
| Apple | 1.11 | 3 | Moderate beta, +6% revenue growth, AA+ credit |
| McKesson | 0.60 | 3 | Low beta, strong +16% revenue growth, stable credit |
| Amazon | 1.31 | 4 | Elevated beta, but strong +12% growth, AA credit |
| Alphabet | 1.16 | 4 | Growth strong (+15%), but antitrust ruling creates uncertainty |
| Cigna | 0.65 | 4 | Stable +11% growth, credit stable |
| ExxonMobil | 0.38 | 5 | Low beta (counter-cyclical), but commodity-driven, revenue -5% YoY |
| UnitedHealth | 0.75 | 6 | Net income declining 16%, CEO crisis (Dec 2024), stock volatile |
| CVS Health | 0.70 | 7 | Net income plunged 62%, BBB on negative outlook, integration risk |
CVS Health scores 7 despite having a low beta (0.70). Beta measures stock price volatility relative to the market. But as a supplier risk indicator, we care more about operational volatility — and a 62% collapse in net income signals deep operational instability. When your supplier’s earnings are in free-fall and their credit rating is on negative watch, the risk isn’t that their stock price fluctuates — it’s that they start cutting costs, reducing service levels, or restructuring in ways that affect your supply.
ExxonMobil’s beta of 0.38 is deceptively low. Energy stocks often have low market beta because they move counter-cyclically to the broader market. But ExxonMobil’s revenue is a rollercoaster driven by commodity prices — it dropped approximately 45% between 2014 and 2016, and declined another 5% in FY2025. If you’re buying fuel or petrochemical feedstocks, that revenue volatility translates directly into pricing instability.
Dimension 5: Concentration/Dependency Risk (20%)
The dimension that kills quietly. Concentration risk isn’t about the supplier’s performance — it’s about the structural fragility that comes from having too many eggs in one basket.
| Company | Score | Key Dependencies |
|---|---|---|
| Berkshire Hathaway | 1 | Most diversified company on Earth — insurance, railroad, energy, retail, tech |
| Amazon | 3 | Well-diversified: retail, AWS, advertising, entertainment |
| Walmart | 4 | Retail dominant, but diversified (grocery, Sam’s Club, Walmart+, ads) |
| Apple | 5 | iPhone >50% of revenue, services growing but hardware-dependent |
| CVS Health | 6 | PBM reform risk, pharmacy + Aetna insurance, regulatory headwinds |
| Cigna | 6 | Insurance + PBM (Express Scripts), healthcare reform vulnerability |
| ExxonMobil | 7 | Oil & gas dominant, commodity price concentration, energy transition |
| UnitedHealth | 7 | Heavy US healthcare regulation, Medicare/Medicaid dependency |
| Alphabet | 7 | Search >55% of revenue, antitrust breakup ruling, ad-dependent |
| McKesson | 7 | Pharma distribution dominant, PBM regulation, opioid litigation legacy |
Four companies share the highest concentration score of 7: ExxonMobil, UnitedHealth, Alphabet, and McKesson. Each for different reasons.
ExxonMobil is locked into fossil fuels with no meaningful diversification path. UnitedHealth is wholly dependent on the US healthcare regulatory regime — a single Medicare reimbursement change can swing billions. Alphabet derives over 55% of revenue from Google Search, and a federal antitrust ruling is currently pursuing a potential breakup of its ad-tech business. McKesson is almost entirely a pharmaceutical distribution business operating on razor-thin margins in a heavily regulated industry.
Berkshire Hathaway at 1 is the mirror image. Insurance, railroads, energy, manufacturing, retail, tech investments — Warren Buffett has built the most radically diversified company in corporate history. As a supplier (BNSF Railway for freight, Berkshire Hathaway Energy for power, Dairy Queen for your corporate catering), the parent company’s diversification is the ultimate backstop.
The Composite Scores: The Full Ranking
Time for the moment of truth. Aggregating all five dimensions with our default weights (Financial 25%, Geographic 20%, ESG 15%, Market Volatility 20%, Concentration 20%), here’s how 10 of the largest Fortune 500 companies rank as suppliers:
| Rank | Company | Financial (25%) | Geographic (20%) | ESG (15%) | Mkt Vol. (20%) | Concentration (20%) | Composite |
|---|---|---|---|---|---|---|---|
| 1 | ExxonMobil | 4 | 7 | 9 | 5 | 7 | 6.15 |
| 2 | CVS Health | 8 | 2 | 4 | 7 | 6 | 5.60 |
| 3 | UnitedHealth | 6 | 2 | 6 | 6 | 7 | 5.40 |
| 4 | McKesson | 7 | 2 | 5 | 3 | 7 | 4.90 |
| 5 | Cigna Group | 5 | 3 | 5 | 4 | 6 | 4.60 |
| 6 | Apple | 2 | 8 | 5 | 3 | 5 | 4.45 |
| 7 | Alphabet | 1 | 4 | 5 | 4 | 7 | 4.00 |
| 8 | Walmart | 4 | 5 | 5 | 2 | 4 | 3.95 |
| 9 | Amazon | 3 | 4 | 6 | 4 | 3 | 3.85 |
| 10 | Berkshire Hathaway | 1 | 3 | 8 | 1 | 1 | 2.45 |
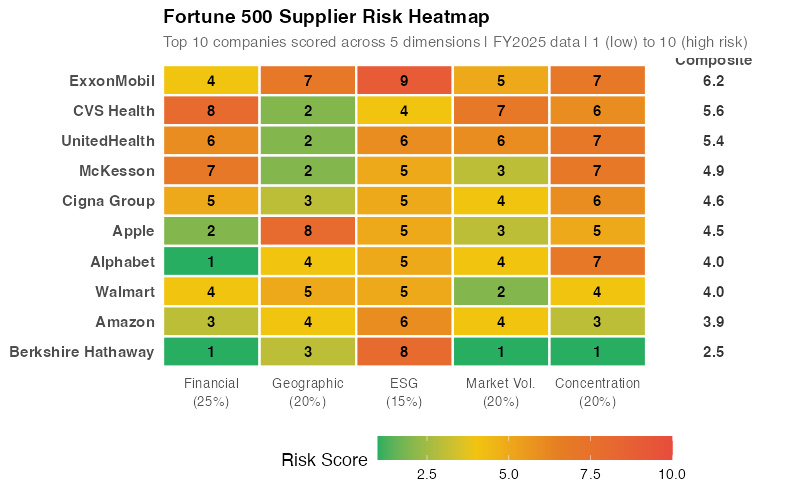
The heatmap reveals something that no stock screener will tell you: the risk profiles of these companies look nothing like their market cap rankings.
The Surprising Insight: Your “Safest” Supplier Might Be Your Riskiest
Let’s unpack the top three and why Wall Street disagrees with this ranking.
ExxonMobil: The Blue-Chip Risk Leader (Composite: 6.15)
ExxonMobil has a pristine AA- credit rating, $28.8 billion in net income, and a perfectly healthy balance sheet. By every traditional financial metric, this is one of the safest companies on Earth. Its financial risk score is a modest 4 out of 10.
But a supply chain risk lens tells a radically different story. ExxonMobil’s composite score of 6.15 — the highest in the group — is driven by three massive non-financial risk factors:
- ESG Risk: 9/10 — Sustainalytics classifies ExxonMobil at 43.7, their Severe Risk category. Active climate litigation, Scope 3 emissions liability, and fundamental misalignment with the energy transition
- Geographic Risk: 7/10 — Operations concentrated in geopolitically volatile resource regions: Middle East, West Africa (Nigeria, Equatorial Guinea), Guyana
- Concentration Risk: 7/10 — Oil & gas dominant business with no meaningful diversification, fully exposed to commodity price cycles and energy transition
If ExxonMobil supplies your fuel, lubricants, or petrochemical feedstocks, these risks translate directly into price volatility, potential supply disruptions from geopolitical events, and escalating compliance costs as carbon regulations tighten. The financial strength is real — but it’s masking risk dimensions that financial analysts don’t typically weight.
CVS Health: The Pharmacy Time Bomb (Composite: 5.60)
This is the one that surprised me most. CVS Health — the company where you buy toothpaste and flu shots — is the second-riskiest supplier on the list. Ahead of Apple. Ahead of Amazon. Ahead of every tech company.
The driver is financial distress. CVS Health’s net margin is 0.4% — which means for every $100 of revenue, CVS keeps forty cents. Net income collapsed 62% year-over-year. The S&P credit rating sits at BBB with a negative outlook, meaning a downgrade into speculative territory is a real possibility. The financial risk score of 8/10 is the worst in the group.
Layer on moderate concentration risk (6/10 — PBM reform threatens a core revenue stream) and elevated market volatility (7/10 — that income collapse signals operational instability), and you get a composite of 5.60.
For procurement teams, CVS matters more than you might think. If your company’s pharmacy benefits, health services, or retail health strategy depends on CVS (and for many large employers, it does), this financial deterioration isn’t academic — it directly affects service levels, contract terms, and long-term viability.
UnitedHealth Group: The Crisis-Tested Giant (Composite: 5.40)
UnitedHealth is the fourth-largest company on the Fortune 500, processing more healthcare transactions than almost any entity in America. Its third-place risk ranking comes from a convergence of factors that individually seem manageable but together paint a concerning picture.
Net income declined 16% year-over-year. In December 2024, the assassination of UnitedHealthcare CEO Brian Thompson — head of UnitedHealth Group’s insurance subsidiary — sent shockwaves through the company and triggered intense public scrutiny of the health insurance industry. AM Best downgraded UnitedHealth’s financial strength rating. Meanwhile, the company’s concentration score of 7/10 reflects an existential dependency on the US healthcare regulatory framework — any meaningful change to Medicare reimbursement, prior authorization rules, or PBM regulations hits UnitedHealth’s core business model.
Financial risk of 6, market volatility of 6, and concentration of 7 create a composite score that places UnitedHealth firmly in the “requires monitoring” zone.
The Apple Paradox: Why the World’s Most Valuable Company Is Only #6
Apple’s ranking at #6 (composite 4.45) will seem too low to anyone who follows supply chain news. After all, Apple’s China manufacturing dependency is one of the most-discussed supply chain risks in the world. And our geographic risk score of 8/10 confirms it — the highest geographic score in the entire group.
But here’s what the multi-dimensional lens reveals: Apple’s financial strength is so exceptional that it anchors the entire composite score downward. A financial risk score of just 2/10 (26.9% margin, AA+ credit, $112 billion in net income) and a market volatility score of 3/10 offset the geographic exposure.
This is precisely why multi-dimensional scoring matters. If you only looked at geographic risk, Apple would be your riskiest supplier. If you only looked at financials, it would be among your safest. The composite tells a more nuanced truth: Apple has a specific, concentrated vulnerability (China manufacturing) wrapped inside an otherwise exceptional risk profile. The mitigation strategy isn’t “avoid Apple” — it’s “ensure you have contingency plans for the geographic exposure while recognizing the financial strength that makes Apple a durable long-term partner.”
The Berkshire Paradox: Safest Overall, Worst on ESG
Berkshire Hathaway’s composite score of 2.45 makes it the lowest-risk supplier in the group by a wide margin. Financial risk: 1/10. Market volatility: 1/10. Concentration: 1/10. With approximately $373 billion in cash and short-term investments (as of Q4 2025), a D/E ratio of 0.18, and a degree of diversification that would make a portfolio manager weep with envy, Berkshire is as close to “risk-free” as a supplier gets.
Except for one dimension: ESG at 8/10.
MSCI rates Berkshire Hathaway BB — the lowest tier of their “Average” band, and the worst ESG rating in our entire group. Warren Buffett has been openly dismissive of ESG reporting requirements. The company provides minimal sustainability disclosure. Berkshire Hathaway Energy still operates significant coal and natural gas assets. If your procurement policy requires minimum ESG thresholds for suppliers (and increasingly, they do), Berkshire Hathaway would fail the screen — despite being the financially safest company on the list.
This tension between financial safety and ESG exposure is one of the most interesting findings of the analysis. It forces a question that many procurement teams haven’t confronted: What happens when your best supplier on four dimensions is your worst on the fifth?
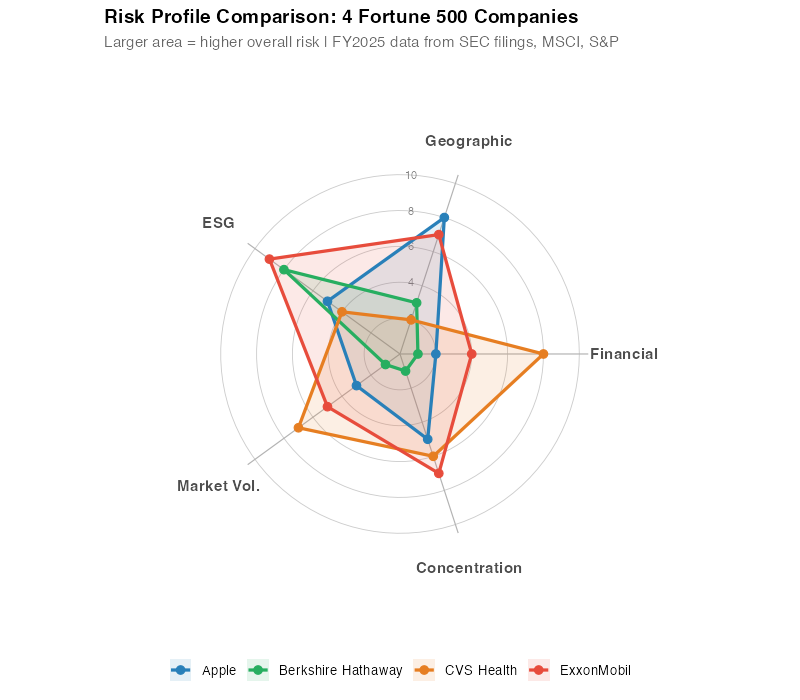
The radar chart makes the contrast visceral. Berkshire Hathaway (composite 2.45) is a tiny, compact polygon with a single spike on ESG — the visual equivalent of a nearly perfect supplier with one Achilles’ heel. Apple (4.45) spikes sharply on geographic risk but stays compact everywhere else. CVS Health (5.60) is a large, lopsided shape driven by its financial distress spike. ExxonMobil (6.15) is the largest polygon of all — elevated across nearly every dimension, with an ESG spike that reaches nearly to the outer ring.
The Scatter Plot: Revenue vs. Risk
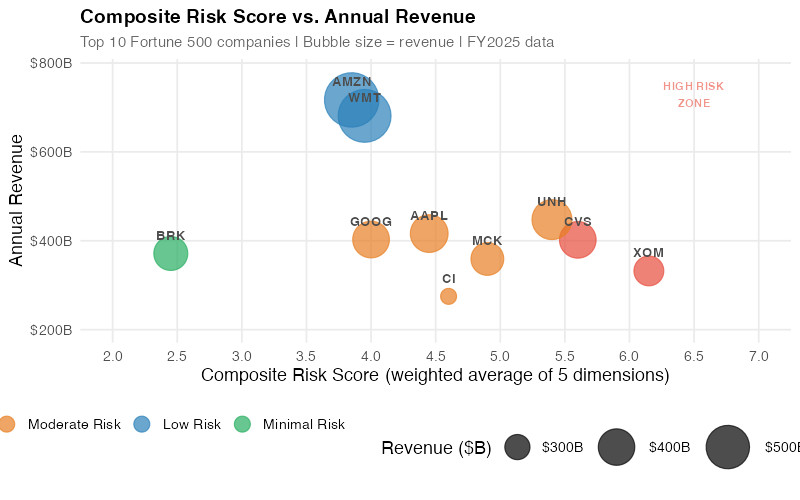
The scatter plot reveals the most counterintuitive finding of the analysis: there is no correlation between company size and supplier risk. The two largest companies by revenue (Amazon at $717B and Walmart at $681B) both score in the low-risk zone. Meanwhile, CVS Health ($402B revenue) and UnitedHealth ($448B revenue) — solidly mid-pack by size — rank as the second and third riskiest suppliers.
If your procurement team uses revenue or market cap as a proxy for supplier stability — and most do, even if they won’t admit it — this chart is your wake-up call.
Breaking Down the Riskiest Supplier: ExxonMobil’s Waterfall
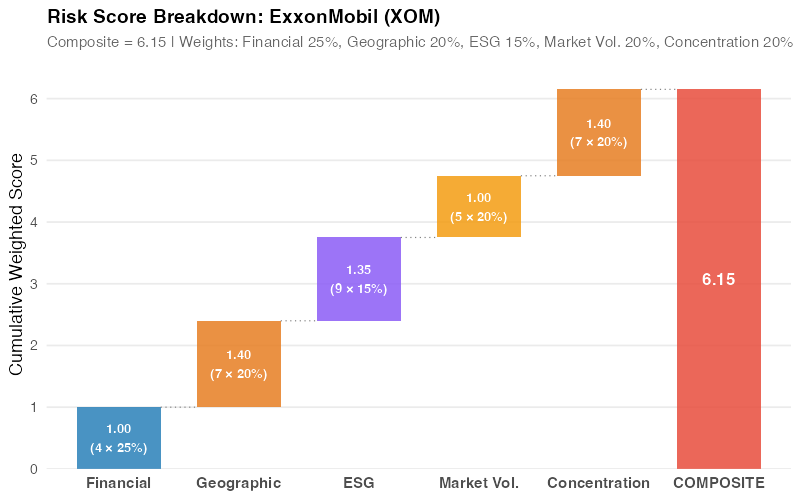
The waterfall chart dissects ExxonMobil’s composite score of 6.15 into its weighted contributions:
- Geographic Risk contributes 1.40 points (7 × 0.20) — tied for the largest driver
- Concentration Risk adds 1.40 points (7 × 0.20) — tied for the largest
- ESG Risk contributes 1.35 points (9 × 0.15)
- Financial Risk adds 1.00 points (4 × 0.25)
- Market Volatility contributes 1.00 points (5 × 0.20)
What’s striking about this breakdown is how evenly distributed the risk is. No single dimension dominates. Financial risk, the dimension that credit analysts obsess over, contributes 1.00 out of 6.15 — just 16.3% of the total. The other 83.7% comes from dimensions that traditional financial analysis either ignores or underweights. This is the blind spot in conventional supplier evaluation.
How I Built This in an Afternoon with Claude Code
Two years ago, this analysis would have taken me three weeks. I did it in an afternoon — using Claude Code, Anthropic’s AI coding assistant that runs directly in your terminal.
Here’s what the workflow actually looked like:
Step 1: Research (20 minutes). I told Claude Code which companies I wanted to analyze and which risk dimensions to cover. It searched SEC filings, pulled FY2025 financial ratios (revenue, net income, D/E, current ratio), looked up S&P credit ratings, found MSCI ESG ratings and Sustainalytics scores, and cross-referenced World Bank governance indicators — all conversationally. I reviewed the numbers, challenged the ones that looked off, and asked for sources. What would have been a full day of copying numbers from EDGAR happened in a back-and-forth conversation.
Step 2: Scoring methodology (10 minutes). I described the five-dimension framework and the weighting logic. Claude Code translated that into a scoring methodology with clear criteria for each dimension, proposed the 1-10 scale, and suggested the default weights. We iterated on the concentration risk definition until it captured both revenue dependency and single-source exposure.
Step 3: R code + visualizations (15 minutes). Claude Code wrote the full R script — data setup, scoring functions, and four publication-quality ggplot2 charts (heatmap, radar, scatter, waterfall). It ran the script, checked the output dimensions, and regenerated any chart that wasn’t quite right. Four charts that would have taken me hours of ggplot2 tweaking were done in minutes.
Step 4: Interactive dashboard (20 minutes). This is where it gets impressive. Claude Code built a self-contained HTML dashboard from scratch — complete with canvas-based charts, weight sliders that recalculate composites in real time, clickable company profiles with drill-down details, and an advisory panel that gives context-aware recommendations. Zero external dependencies. One file. Under 50KB. The kind of thing that would have taken me a week of JavaScript debugging.
Step 5: Fact-checking (15 minutes). And here’s the part that matters most: Claude Code also fact-checked its own work. It verified every financial ratio against SEC filings, caught that Alphabet’s MSCI ESG rating was BBB (not the AA it had initially assumed), flagged that Google dropped its carbon-neutrality claim in 2024, and corrected the Fortune 500 ranking for Cigna. The errors it caught are the same errors that would have slipped past me if I’d done the research manually — because I would have been too tired by hour six to double-check the ESG ratings.
Total time: about 90 minutes from “I want to score Fortune 500 companies as suppliers” to a finished blog post with verified data, four charts, and an interactive dashboard.
The analytical framework in this post is not new — Altman published the Z-Score in 1968, the World Bank has published governance indicators for decades, and MSCI ESG ratings have existed for years. What’s new is that tools like Claude Code let a single supply chain professional research, assemble, code, visualize, and fact-check this kind of multi-source analysis in the time it used to take just to set up the spreadsheet.
The implication for procurement teams is profound: the excuse that “we don’t have the resources for sophisticated supplier risk analytics” is no longer valid. The data is public. Claude Code is accessible. The only barrier left is knowing which questions to ask — and that’s what supply chain expertise is for.
Where This Approach Breaks: Honest Limitations
Let’s not oversell this. A blog post analysis of Fortune 500 companies has real limitations, and pretending otherwise would undermine the framework’s credibility.
1. These are public companies. The scoring framework works beautifully for publicly traded Fortune 500 companies because they must disclose financial data, risk factors, and geographic exposure in their 10-K filings. Your actual supplier portfolio likely includes private companies where data is scarce. For private suppliers, you’ll need proxy indicators: Dun & Bradstreet ratings, payment behavior data from your AP system, or — if you have the purchasing leverage — direct financial disclosure requirements in your supplier qualification process.
2. Static snapshot, not real-time monitoring. The scores in this analysis reflect FY2025 data — a point in time. Financial ratios change quarterly. ESG ratings are updated annually. Geopolitical events happen overnight. A risk scoring framework is a foundation — it tells you where to look, not what’s happening right now. Real-time monitoring (news feeds, regulatory alerts, weather tracking) is the complement to periodic scoring, and that’s where commercial platforms like Resilinc, Everstream, and Prewave add genuine value.
3. Sub-tier visibility is zero. We’ve scored these companies as direct (Tier 1) suppliers. But supply chain disruptions often originate at Tier 2 or Tier 3. Apple’s geographic risk score of 8 captures Apple’s own manufacturing concentration — but not the geographic risk of Apple’s suppliers’ suppliers. The 2021 Texas winter storm disrupted chemical feedstocks that flowed through three or four tiers before affecting consumer products. No public-data analysis captures this.
4. Weighting is subjective. Our default weights (Financial 25%, Geographic 20%, ESG 15%, Volatility 20%, Concentration 20%) are reasonable starting points, but they encode assumptions. A company sourcing critical pharmaceuticals might weight Concentration at 35%. A company with aggressive sustainability commitments might push ESG to 25%. The interactive dashboard lets you experiment with different weightings — and you should.
5. ESG scoring is noisy. MSCI rates ExxonMobil BBB (“Average”), while Sustainalytics gives it a Severe Risk score of 43.7. Same company, same year, wildly different assessments. ESG data is inherently more subjective than financial data, and different agencies weight different factors. We use a composite approach, but the uncertainty is real.
Interactive Dashboard
Explore the data yourself — adjust dimension weights, compare companies side-by-side, and see how different priorities shift the rankings.
Interactive Dashboard
Explore the data yourself — adjust parameters and see the results update in real time.
Show R Code
# =============================================================================
# Supplier Risk Scoring — Real Fortune 500 Data
# =============================================================================
# Generates 4 visualizations using REAL public financial and risk data for the
# 10 of the largest Fortune 500 companies (2024 ranking, FY2025 financial data).
#
# Data sources:
#   - Financial metrics: SEC 10-K filings, Yahoo Finance, MacroTrends (FY2025)
#   - Credit ratings: S&P Global, Moody's (latest available 2024-2025)
#   - ESG scores: MSCI ESG Ratings, Sustainalytics (2025)
#   - Beta: Yahoo Finance 5-year monthly (as of early 2026)
#   - Geographic: Company filings, World Bank WGI, news reports
#
# Required packages: ggplot2, dplyr, tidyr, scales, patchwork
# Output: Images/srisk_*.png (800px wide, white background)
# =============================================================================

library(ggplot2)
library(dplyr)
library(tidyr)
library(scales)
library(patchwork)

# --- Theme for all plots ---
theme_srisk <- theme_minimal(base_size = 13) +
  theme(
    plot.title = element_text(face = "bold", size = 14),
    plot.subtitle = element_text(color = "grey40", size = 11),
    panel.grid.minor = element_blank(),
    legend.position = "bottom"
  )

# =============================================================================
# REAL COMPANY DATA — Top 10 Fortune 500 (2024 Ranking)
# =============================================================================
# All financial data from FY2025 annual reports / 10-K filings.
# Risk scores are 1-10 (10 = highest risk), derived from documented methodology.

companies <- data.frame(
  company = c("Walmart", "Amazon", "Apple", "UnitedHealth",
              "Berkshire Hathaway", "CVS Health", "ExxonMobil",
              "Alphabet", "McKesson", "Cigna Group"),
  ticker = c("WMT", "AMZN", "AAPL", "UNH", "BRK", "CVS",
             "XOM", "GOOG", "MCK", "CI"),

  # --- Revenue (FY2025, $B) — SEC filings, MacroTrends ---
  revenue_B = c(681.0, 716.9, 416.2, 447.6, 371.4,
                402.1, 332.2, 402.8, 359.1, 274.9),

  # --- Net Profit Margin (FY2025) ---
  net_margin_pct = c(2.9, 10.8, 26.9, 2.7, 18.0,
                     0.4, 8.7, 32.8, 0.9, 2.2),

  # --- S&P Credit Rating ---
  sp_rating = c("AA", "AA", "AA+", "A+", "AA",
                "BBB", "AA-", "AA+", "BBB+", "A-"),

  # --- Beta (5Y Monthly, Yahoo Finance) ---
  beta = c(0.65, 1.31, 1.11, 0.75, 0.60,
           0.70, 0.38, 1.16, 0.60, 0.65),

  # --- MSCI ESG Rating ---
  msci_esg = c("BBB", "BBB", "BBB", "BBB", "BB",
               "A", "BBB", "AA", "A", "BBB"),

  stringsAsFactors = FALSE
)

# =============================================================================
# RISK SCORING (1-10, 10 = highest risk)
# =============================================================================

# --- Dimension 1: Financial Risk (Weight: 25%) ---
companies$financial <- c(
  4,  # WMT: Thin margin (2.9%), current ratio 0.78, but AA credit, Z 6.93
  3,  # AMZN: 10.8% margin, cash > LTD, AA credit
  2,  # AAPL: 26.9% margin, AA+ credit, D/E 1.03
  6,  # UNH: 2.7% margin, net income -16%, AM Best downgrade
  1,  # BRK: 18% margin, ~$373B cash/ST investments, D/E 0.18
  8,  # CVS: 0.4% margin, NI -62% YoY, BBB negative outlook
  4,  # XOM: 8.7% margin, AA- credit, revenue -5%
  1,  # GOOG: 32.8% margin, current ratio 2.01, AA+ credit
  7,  # MCK: 0.9% margin, negative equity (-$2.1B), BBB+
  5   # CI: 2.2% margin, current ratio 0.79, A-
)

# --- Dimension 2: Geographic Risk (Weight: 20%) ---
companies$geographic <- c(
  5,  # WMT: 19 countries incl. Mexico, India, China, South Africa
  4,  # AMZN: Global but services-based
  8,  # AAPL: 80-90% manufacturing in China, TSMC dependency
  2,  # UNH: Primarily US (90%+)
  3,  # BRK: Global through subsidiaries, mainly developed markets
  2,  # CVS: Almost entirely US-focused
  7,  # XOM: Middle East, West Africa, politically volatile regions
  4,  # GOOG: Global but services-based
  2,  # MCK: US + Canada + some Europe
  3   # CI: Primarily US, some international
)

# --- Dimension 3: ESG Risk (Weight: 15%) ---
companies$esg <- c(
  5,  # WMT: MSCI BBB, Sustainalytics 25.3 (Medium)
  6,  # AMZN: MSCI BBB, worker safety + antitrust
  5,  # AAPL: MSCI BBB, supply chain labor, strong carbon targets
  6,  # UNH: MSCI BBB, healthcare access, CEO crisis
  8,  # BRK: MSCI BB (lowest-tier Average), minimal disclosure
  4,  # CVS: MSCI A, Sustainalytics 18.7 (Low)
  9,  # XOM: MSCI BBB but Sustainalytics 43.7 (SEVERE), climate litigation
  5,  # GOOG: MSCI BBB, dropped carbon-neutral claim 2024, antitrust + privacy
  5,  # MCK: MSCI A, opioid history
  5   # CI: MSCI BBB, healthcare affordability
)

# --- Dimension 4: Market Volatility Risk (Weight: 20%) ---
companies$market_vol <- c(
  2,  # WMT: Beta 0.65, stable +5% growth
  4,  # AMZN: Beta 1.31, strong +12% growth
  3,  # AAPL: Beta 1.11, moderate +6% growth
  6,  # UNH: NI -16%, CEO crisis, stock volatile
  1,  # BRK: Beta 0.60, ~$373B cash/ST investments buffer
  7,  # CVS: NI -62%, BBB negative outlook
  5,  # XOM: Commodity-driven, revenue -5%
  4,  # GOOG: Beta 1.16, +15% growth, antitrust uncertainty
  3,  # MCK: Beta 0.60, strong +16% growth
  4   # CI: Beta 0.65, +11% growth
)

# --- Dimension 5: Concentration/Dependency Risk (Weight: 20%) ---
companies$concentration <- c(
  4,  # WMT: Retail dominant but diversified
  3,  # AMZN: Well-diversified (retail, AWS, ads)
  5,  # AAPL: iPhone >50% revenue
  7,  # UNH: US healthcare regulation dependency
  1,  # BRK: Most diversified company on Earth
  6,  # CVS: PBM reform + Aetna integration risk
  7,  # XOM: Oil & gas dominant, energy transition
  7,  # GOOG: Search >55%, antitrust breakup risk
  7,  # MCK: Pharma distribution dominant, regulated
  6   # CI: Insurance + PBM, healthcare reform risk
)

# --- Composite Score (Weighted Average) ---
w_fin  <- 0.25  # Financial stability is paramount
w_geo  <- 0.20  # Geographic exposure affects resilience
w_esg  <- 0.15  # ESG increasingly material
w_mvol <- 0.20  # Market volatility signals stability
w_conc <- 0.20  # Concentration drives fragility

companies$composite <- round(
  w_fin  * companies$financial +
  w_geo  * companies$geographic +
  w_esg  * companies$esg +
  w_mvol * companies$market_vol +
  w_conc * companies$concentration, 2
)

companies <- companies %>% arrange(desc(composite))

# Print ranked results
cat("=== Fortune 500 Supplier Risk Scores (FY2025 Data) ===\n")
print(companies %>% select(company, ticker, composite, revenue_B) %>%
        mutate(rank = row_number()))

# =============================================================================
# APPLY TO YOUR OWN DATA
# =============================================================================
# To adapt this framework for your supplier portfolio:
#
# 1. Replace the `companies` data frame with your own suppliers
# 2. Adjust weights to match your risk appetite (must sum to 1.0)
# 3. Scoring guide:
#    Financial:     Altman Z-Score, credit rating, D/E, profit margin
#    Geographic:    World Bank WGI, political stability, logistics risk
#    ESG:           MSCI rating, Sustainalytics score, controversy level
#    Market Vol.:   Beta, revenue trend, credit outlook changes
#    Concentration: Revenue segment HHI, customer dependency, regulatory risk
References
- Altman, E. I. (1968). “Financial Ratios, Discriminant Analysis and the Prediction of Corporate Bankruptcy.” The Journal of Finance, 23(4), 589-609.
- World Bank. (2025). Worldwide Governance Indicators. Washington, DC: World Bank Group. Available at databank.worldbank.org.
- MSCI. (2025). MSCI ESG Ratings Methodology. New York: MSCI Inc.
- Sustainalytics. (2025). ESG Risk Ratings. Amsterdam: Morningstar Sustainalytics.
- S&P Global Ratings. (2025). Corporate Credit Rating Actions and Outlooks. New York: S&P Global.
- U.S. Securities and Exchange Commission. (2025). EDGAR Full-Text Search — 10-K Annual Reports. Available at efts.sec.gov.
- Chopra, S., & Sodhi, M. S. (2014). “Reducing the Risk of Supply Chain Disruptions.” MIT Sloan Management Review, 55(3), 73-80.
- Hendricks, K. B., & Singhal, V. R. (2005). “An Empirical Analysis of the Effect of Supply Chain Disruptions on Long-Run Stock Price Performance and Equity Risk of the Firm.” Production and Operations Management, 14(1), 35-52.
- Simchi-Levi, D., Schmidt, W., & Wei, Y. (2014). “From Superstorms to Factory Fires: Managing Unpredictable Supply-Chain Disruptions.” Harvard Business Review, 92(1-2), 96-101.
- CDP (formerly Carbon Disclosure Project). (2025). CDP Scores: Corporate Environmental Action Tracking. London: CDP Worldwide.
Leave a Reply