
The purchasing team has a beautiful chart. The largest supplier is, once again, the largest supplier. Everyone nods. Someone asks whether the colours can match the new corporate template.
Meanwhile, four sites are buying the same specification at different prices, a perfectly good contract is being ignored, and nobody is quite sure whether two supplier names belong to the same company.
That’s where spend analysis should earn its keep.
It gives purchasing a reliable view of what the organisation buys, from whom, through which parts of the business, and on what commercial terms. Then it helps people decide what deserves investigation, negotiation, standardisation or protection.
I want a dashboard to change decisions. The standalone Spend Observatory below demonstrates that approach. You can filter it, inspect its transactions, change its assumptions and export its evidence. Every company, supplier and invoice in the demonstration is fictional. The opportunities are illustrative scenarios; there are no customer results or realised savings hiding behind them.
Open the interactive Spend Observatory
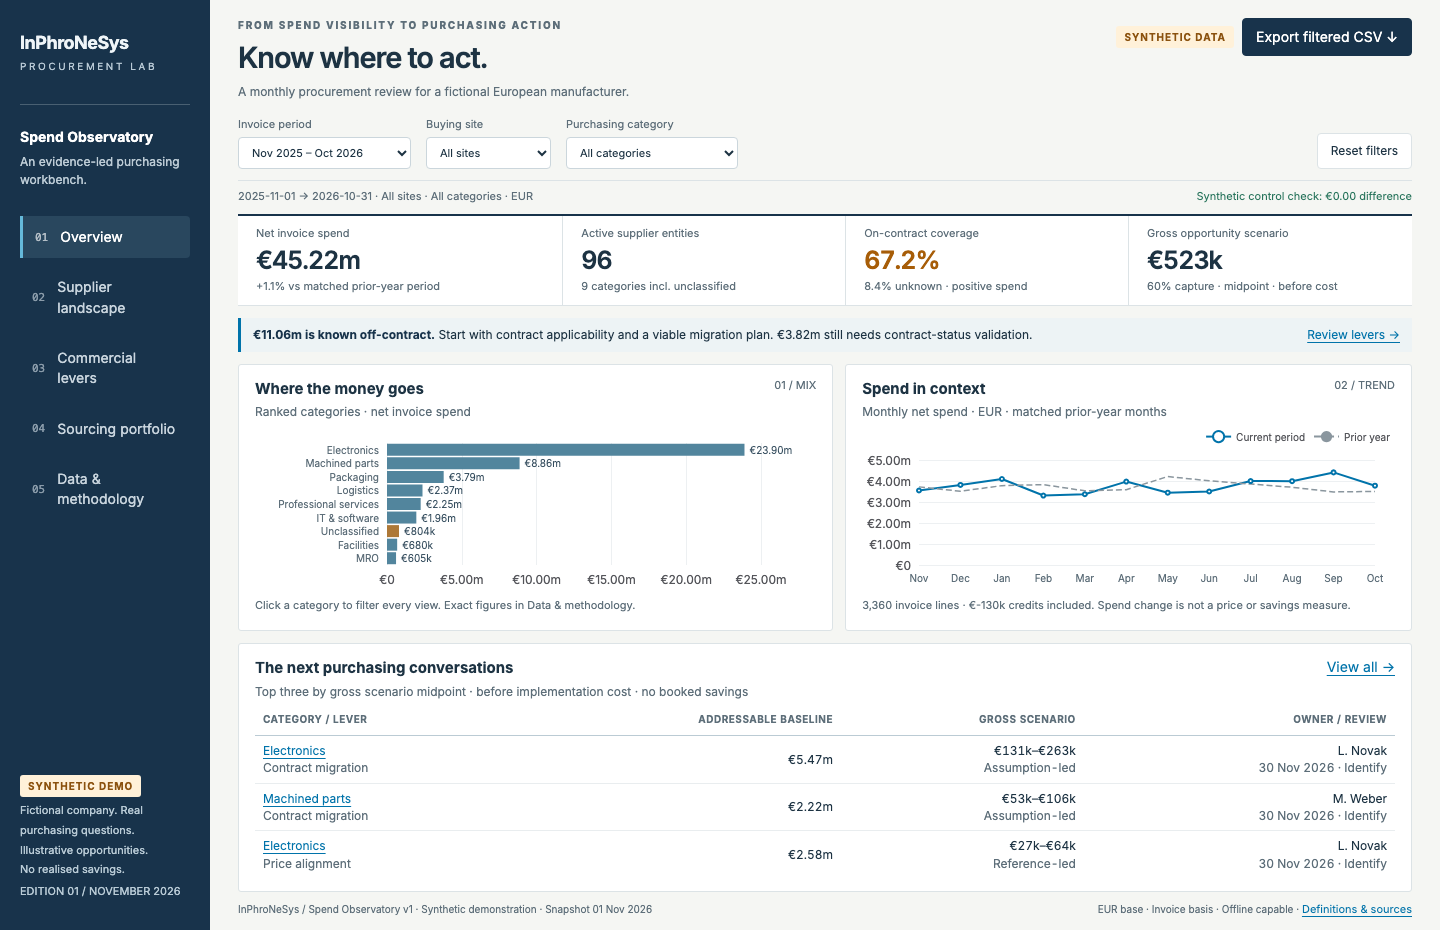
The overview uses fictional invoices. Open the dashboard to filter a site, inspect a finding and export its evidence.
What spend analysis actually means
CIPS describes spend analysis around collecting, classifying and analysing expenditure data. That sounds straightforward until an ERP export introduces you to seven spellings of the same supplier. CIPS: Spend Analysis
The US Government Accountability Office frames the practical questions well: who buys, who supplies, what is purchased, how much is spent, and where buying power might be used more effectively. Its report dates from 2004. The foundations aren’t new. GAO: Using Spend Analysis to Help Agencies Take a More Strategic Approach to Procurement
A useful analysis connects three layers:
- A trustworthy baseline: signed invoice lines, consistent currency, supplier identities, categories and financial controls.
- Commercial diagnosis: the reasons a category or supplier deserves attention.
- An action: owner, evidence and review date.
A spend cube groups expenditure by category, supplier, buying organisation and time. It makes the baseline easier to explore. It becomes useful when that exploration changes a decision.
What purchasing can do with it
The following are practical uses, not promises of automatic benefit.
| Purchasing question | Evidence to examine | Possible next move |
|---|---|---|
| Are sites buying separately where aggregation could help? | Comparable specifications, suppliers, volumes and local constraints | Test a coordinated sourcing event |
| Is an existing contract being used? | Contract applicability, invoice status, price and buying channel | Fix access, applicability or buying behaviour |
| Why does the same item cost more here? | Matched specification, unit, timing, quantity tier, freight and terms | Validate a reference and investigate the difference |
| Is the supplier base difficult to manage? | Supplier distribution, order frequency, cost of processing and criticality | Simplify suitable purchases without weakening continuity |
| Are we becoming dependent? | Spend concentration plus qualified alternatives, capacity and recovery time | Review continuity and alternate-source readiness |
| Which work deserves attention first? | Addressable value, execution uncertainty, cost and business consequence | Assign a category owner and a validation step |
The word comparable does real work. A price difference between a pallet order and an emergency single-unit shipment is not automatically a negotiation opportunity. The cheapest recorded invoice isn’t an executable supplier quote either.
Payment terms deserve their own analysis. That needs its own cash-flow assumptions and should stay separate from P&L savings. The demonstration deliberately focuses on contract migration and price investigation so readers can inspect two clear levers in detail.
Start with the unglamorous part
Before looking for opportunities, agree on what the money means.
Are we analysing invoices, purchase orders, receipts or payments? Does the amount include tax or freight? Are credits included? Which entities and months belong in the population? Which exchange rates were used?
The dashboard uses signed invoice-line values in EUR, excluding VAT, freight, intercompany and cancelled invoices. It shows net spend for financial totals, while coverage, concentration and opportunity calculations use positive invoice values. Credits remain visible instead of quietly disappearing.
Supplier raw names sit alongside normalised entities and corporate parents. Unclassified spend stays in the dataset. Unknown contract status remains unknown: a missing answer is not proof of a policy breach.
In a live implementation, Finance would need to agree the control totals and exclusions. This demonstration checks its transaction arithmetic against synthetic monthly/site controls generated from the same fictional source. The controls come from the same generator. They demonstrate arithmetic consistency; an actual rollout still needs an independent ledger reconciliation.
What the dashboard shows
The primary screen is a compact monthly review: net spend and its matched prior-year comparison, active suppliers, contract coverage, category ranking, monthly trend, and three purchasing conversations worth opening.
Four supporting views provide the detail:
Supplier landscape. The Pareto distribution is calculated. There’s no assumed 80/20 split. A configurable tail threshold exposes how many supplier parents sit below a selected-period spend amount. Parent-level concentration is a diagnostic; it cannot tell you whether an apparently diverse supplier base shares one upstream source.
Commercial levers. Known off-contract spend provides a migration baseline. Contracted lines above an illustrative same-item reference provide a separate price-investigation population. Each opportunity shows a formula, owner, scope, dependency, review date and implementation-cost assumption. Those two populations do not overlap.
Sourcing portfolio. A Kraljic-style matrix distinguishes business impact from supply risk. The named framework provides the portfolio reference. The demo shows its factor ratings and weights. You can move the classification boundary to see which categories change posture. Those scores are illustrative implementation choices. Peter Kraljic: Purchasing Must Become Supply Management
Data and methodology. The invoice explorer exposes original currencies, illustrative FX rates, supplier-name variants, categories, contract status and signed EUR values. Inspect a line. Or export the active population. Definitions and source links travel with the dashboard.
The manufacturer is fictional. Its dataset contains 6,720 invoice lines over 24 months, four sites, eight purchasing categories and 96 supplier entities. The latest review covers November 2025 through October 2026. Smaller time windows compare with the same months one year earlier.
Follow one finding all the way to a decision
Start with the default twelve-month view. It contains €45.22 million of net invoice spend. Known on-contract purchases account for 67.2% of positive spend; €3.82 million has unknown contract status. These are generated demonstration values, not industry benchmarks.
There’s work to do before negotiating.
Open Commercial levers first. Choose Electronics / Contract migration. The addressable baseline is about €5.47 million of known off-contract positive invoices. With the default 4–8% saving assumption and 60% execution capture, the gross scenario is about €131,000–€263,000. The detail drawer shows the owner, scope, formula and dependencies, plus a separate €5,000 implementation-cost assumption.
Those assumptions are editable. Try a lower capture rate. Then export the opportunity lines and ask whether the contract really covers those specifications, sites and volumes. A supplier’s capacity or an urgent qualification requirement could change the answer.
The next step is validation. The same screen keeps unknown contract statuses out of this opportunity population. Turning a missing field into a saving would make the chart more exciting, but it wouldn’t make purchasing better.
An opportunity is not a saving
Suppose an analysis finds €1 million of known off-contract expenditure. That is an exposed baseline. That doesn’t establish whether the full amount can move to a contract, or whether a particular discount is available.
For illustration, a 4–8% saving assumption and 60% execution capture would produce a €24,000–€48,000 gross scenario on that baseline. Those percentages are example inputs, not research benchmarks. Implementation cost still needs to be deducted. Capacity, specification, continuity and contract applicability still need to be checked.
The dashboard lets readers change these assumptions. Its default midpoint is a way to rank validation work, not a prediction. Negative net cases remain visible when the illustrative implementation cost exceeds the potential benefit.
After validation, the team still has to source, implement and measure the result. Finance-approved realised benefit belongs at the end of that chain.
What this dashboard cannot decide for you
Spend concentration deserves attention. It doesn’t establish supply risk. Several suppliers might depend on the same factory, technology or transport lane. A smaller supplier could supply a cheap component that stops a production line. Neither case can be diagnosed from invoice totals alone.
The sourcing portfolio therefore uses separate synthetic assessments of operational consequence, margin exposure, qualification difficulty, capacity constraint and recovery time. Moving its boundary tests a classification choice. It isn’t a substitute for reviewing the underlying evidence.
The same caution applies to demand. Purchase invoices describe buying transactions; they aren’t a complete history of consumption or customer demand. Inventory variability and forecasting need their own data. This dashboard leaves those decisions outside its scope.
Why it looks restrained
The design follows Stephen Few’s emphasis on a compact monitoring view that people can examine quickly. Comparison comes first. The overview uses aligned numbers, ranked bars and a time-series comparison. Colour draws attention to exceptions; it does not give every category its own marketing department. Few’s critique is useful here: visual technology does not rescue poor information design. Stephen Few: Why Most Dashboards Fail
The charts use Apache ECharts 6.1.0, listed as an active release in Apache’s catalogue when checked on 15 November 2026. Its SVG renderer supports sharp charts without requiring a remote chart service. The file embeds the library and transactions. It opens offline and can sit beside a blog article. “Current” is a dated software check, not a claim that one library is best for every situation. Apache release catalogue, ECharts renderer guidance
The useful sophistication is in the linked evidence: a filter affects the views, an opportunity exposes its exact invoice population, and assumptions are available to challenge.
How to try this in your own purchasing team
Start with one category. Gather enough invoice history for a meaningful comparison. Agree the financial basis, exclusions and control totals with Finance. Normalise supplier identities, classify the lines, and join contract information with explicit unknown values.
Choose decisions you can act on. Validate a few opportunities with category owners and executable supplier evidence. Record implementation cost, overlap and continuity constraints before adding anything to a benefits pipeline.
Only then expand the scope. A useful first release is one where a buyer can explain a finding and take a defensible next step.
Try the dashboard: filter a site, open a commercial lever, and inspect its invoice scope. Then change the capture assumption. The question is whether the evidence is strong enough to justify the next purchasing conversation.
Disclosure: All data is synthetic. FX rates, reference prices, risk factors, opportunity assumptions, owners and costs are illustrative. The dashboard demonstrates analytical and interface behaviour, not proven commercial outcomes. It doesn’t connect to an ERP, execute purchases or provide a full production spend-management system.
Created with AI assistance under human editorial control.
Leave a Reply