Today we would like to introduce ternary plots. There is a very nice package available that is called ggtern which helps you to make ternary plots in ggplot2. ggtern is made possible by Nicholas Hamilton. You can find his website here.
Ternary plots are very useful, because they let you plot three variables on a two-dimensional graph. They also let you see the proportions of the three variables you are analyzing very quickly.
Ternary plots need a special kind of problem to work. You need to have a parts of a whole problem, to be able to successfully use them. It is important, that the three parameters you are analyzing add up to 100 percent. So when using them, you have to make sure that your problem (or the variables you are analyzing) consist of 3 variables and that in sum they add up to 100 percent.
I had to think a little to find a problem that fits this kind of solution in the area of operations-, or supply chain management. I then remembered, that product costs are almost always calculated by analyzing the material, labour and burden (also called overhead) content. In sum, these three cost elements should also add up to 100 percent of the total product cost. Not considering things like landed cost, total cost of ownership, etc.
Below you will find several products, which have been analyzed with ternary plots by using their material, labor and overhead cost elements.

Ternary plots can be a bit challenging to read, especially when you see them the first time.
To be able to better read a ternary plot, I have made an example that shows you were the different axes are and in which places to read the corresponding information.
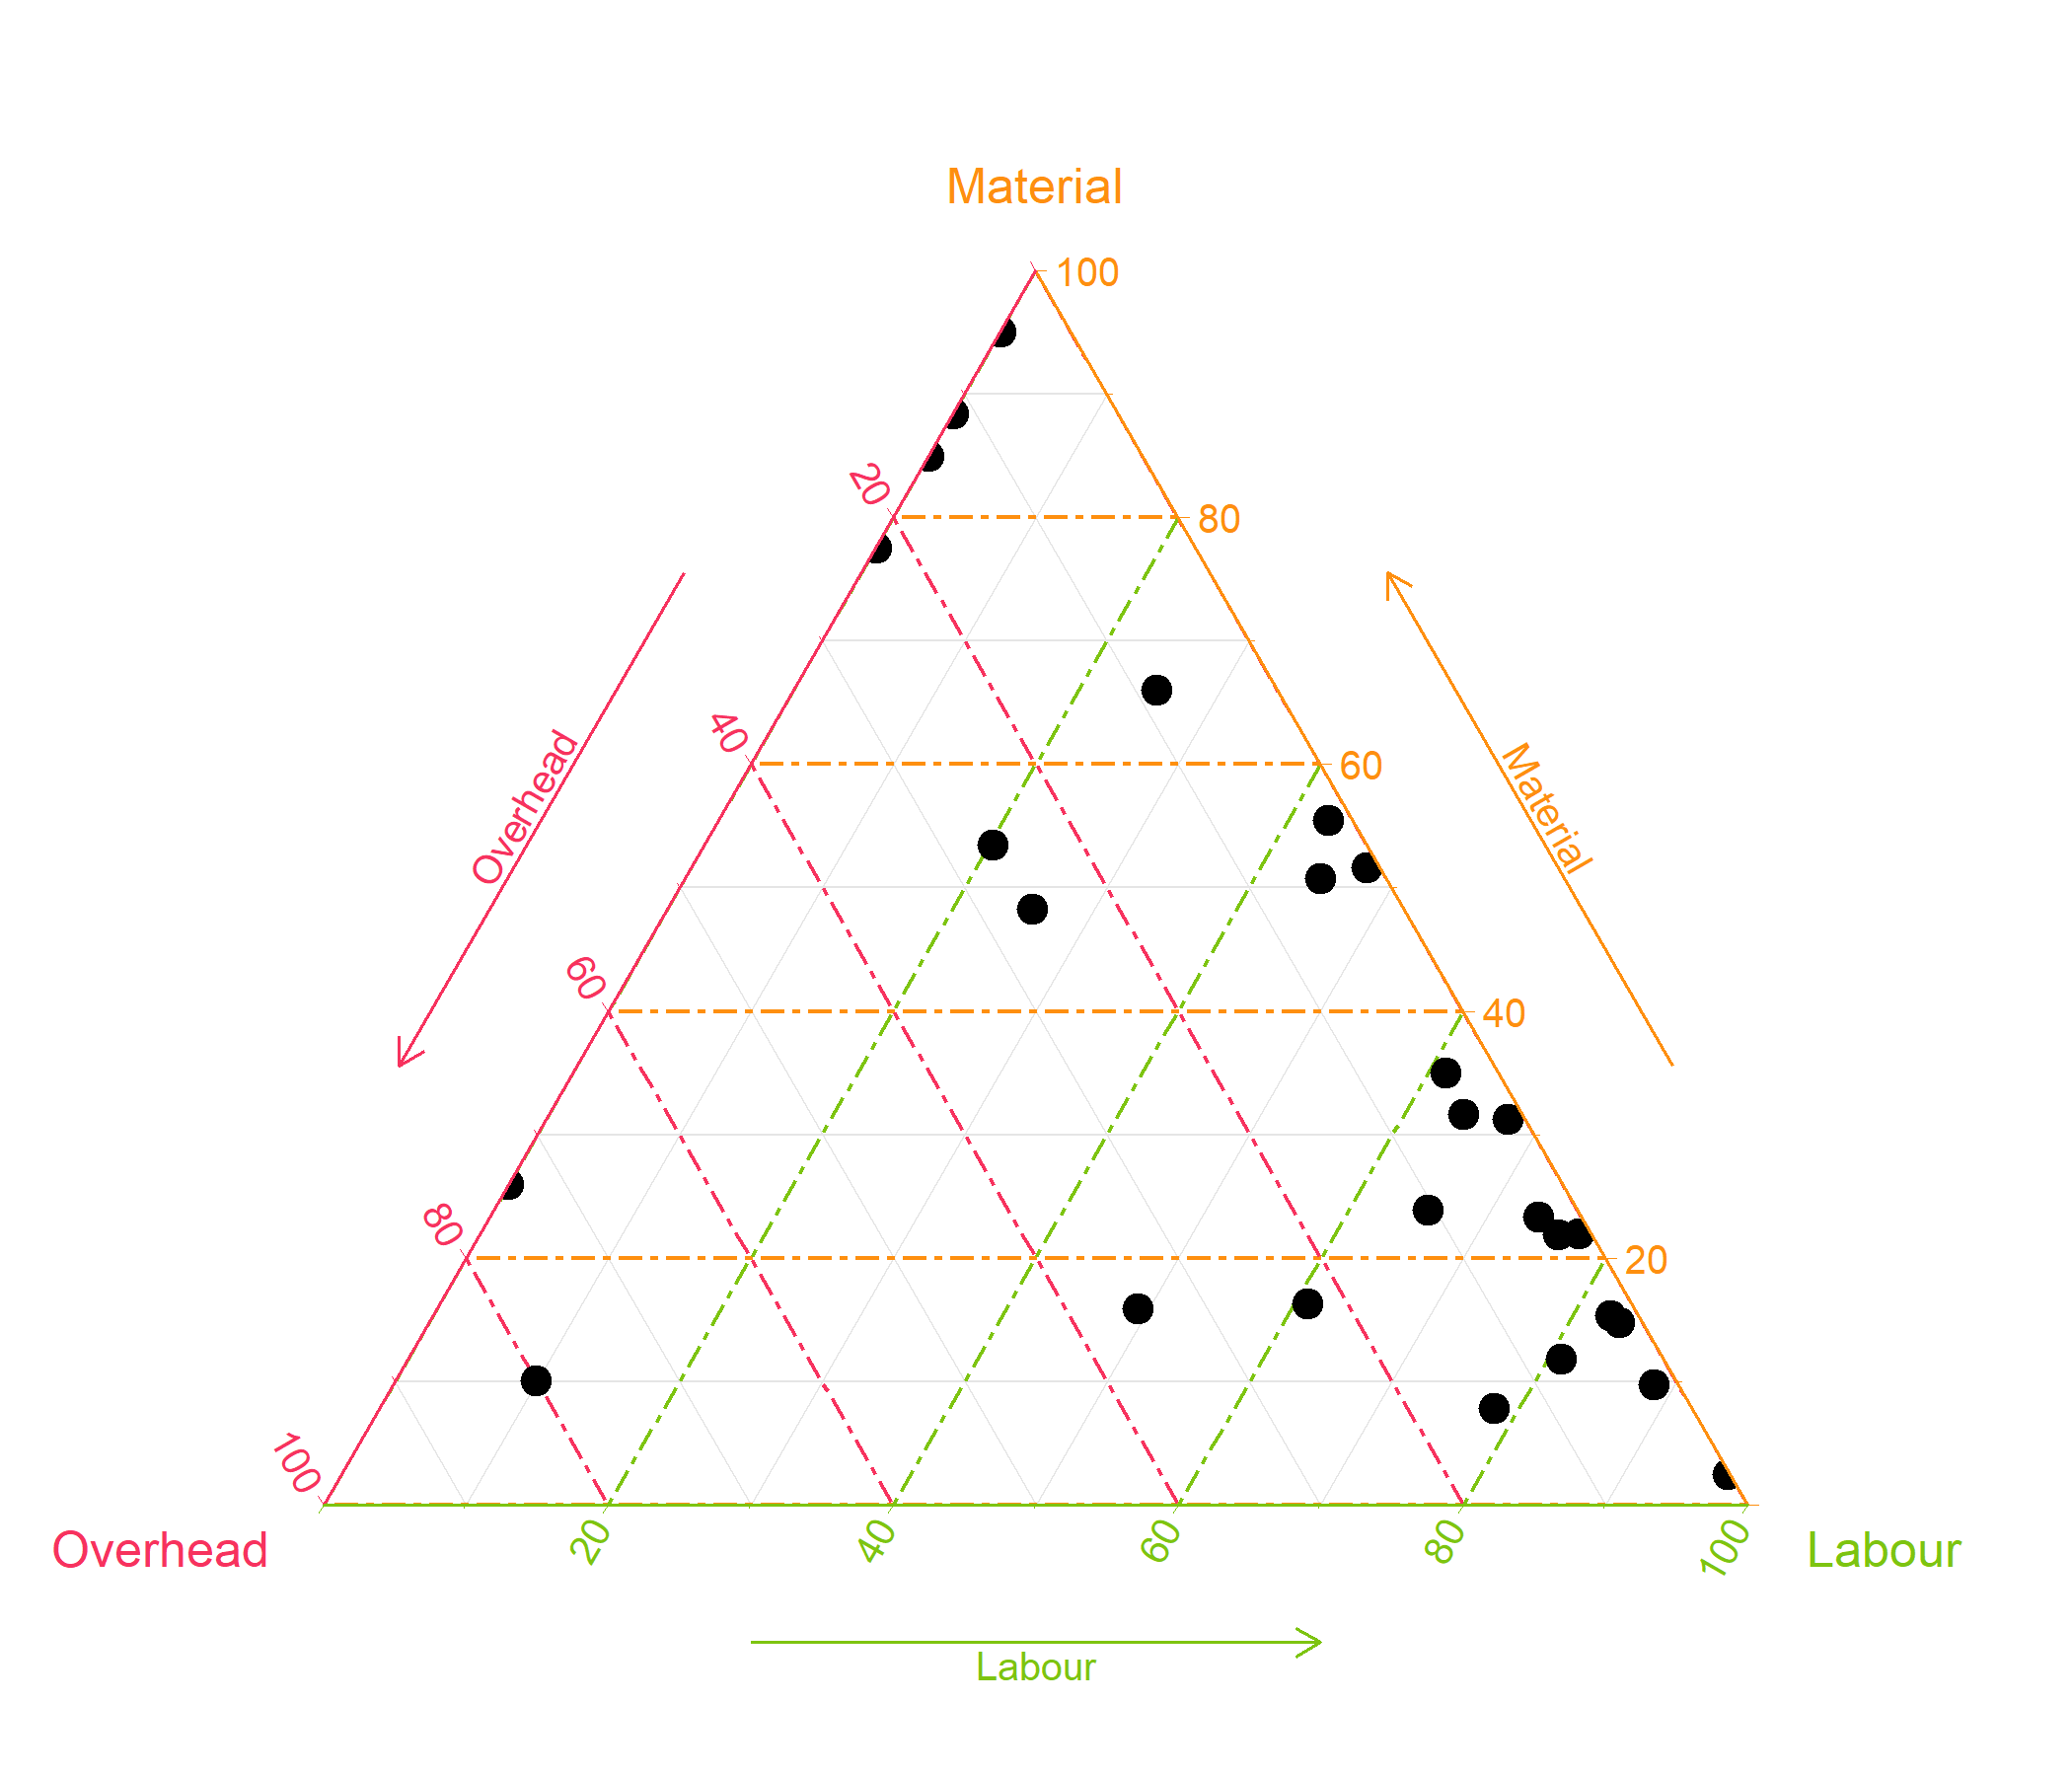
Let’s look at the point in the lower left corner. Looking at the overhead axis (red) tells you, that 80 percent of the product costs are related to overhead costs. Roughly 10 percent is related to labour cost (which is the green axis) and another 10 percent is related to material cost. When you add up all the percentages you will have 100 percent! The product is highly driven by overhead cost.
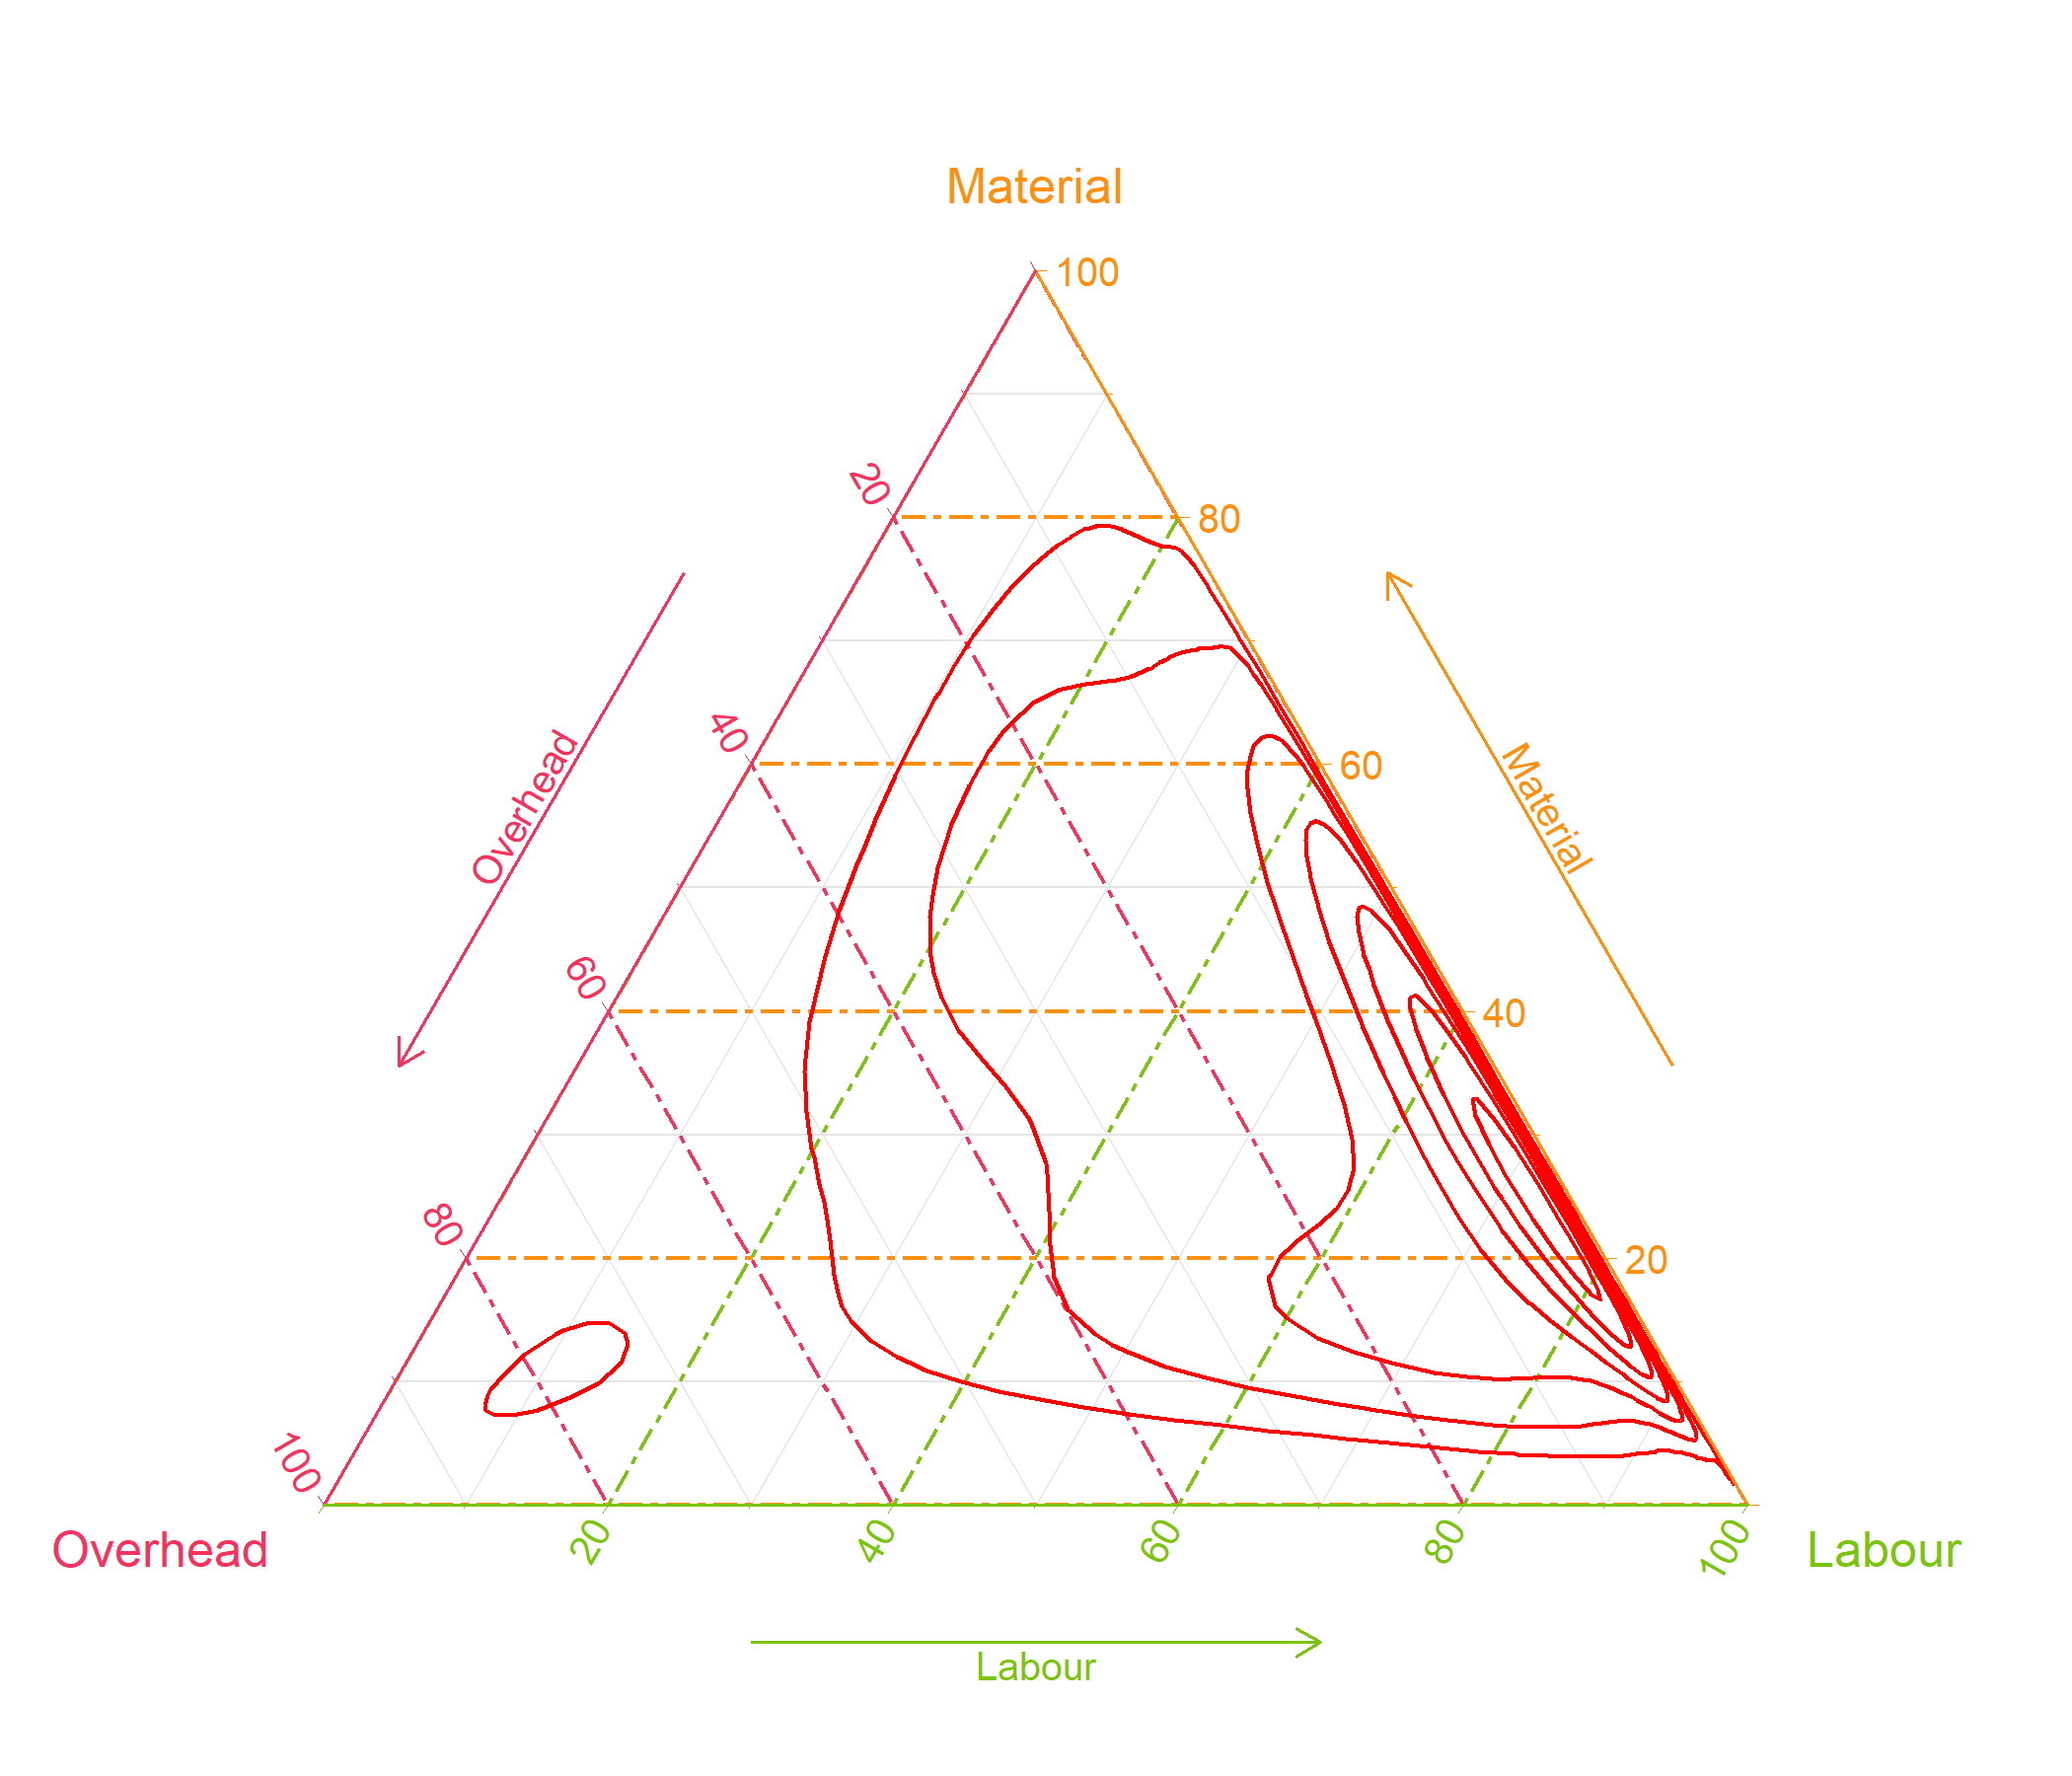
So in this case, if our products would have a cost distribution as shown in the above plot, we would have products where many of the main cost drivers are labour cost related. If you would like to find the biggest cost saving leverage in your product portfolio, you now know, that it will be labour cost related elements.
Below is another plot that shows the concentration of the cost drivers.
Ternary plots can be a very fast way to understand the cost distribution of your product portfolio and help you see where the biggest cost saving leverage is.
Schreibe einen Kommentar