The commander who waits for certainty arrives too late.
That sentence is not a slogan. It is the operating condition of every strategy review, every board meeting, every supplier-failure conference call you have ever sat in. The data was incomplete. The window was closing. Someone had to choose. And the slowest part of the room was always the one demanding more analysis.
Clausewitz wrote about this two centuries ago. His answer was unfashionable enough that it has been quietly written out of the modern strategy curriculum. It was not better data. It was better judgment.
“War is the province of uncertainty: three-fourths of those things upon which action in war must be calculated, are hidden more or less in the clouds of great uncertainty.”
— Carl von Clausewitz, On War, Bk. I, Ch. III, trans. Col. J. J. Graham (1873)
Three-fourths. Hidden. Not “pending the next data refresh.” The strategist’s working environment is, by his measurement, mostly invisible — and yet the work still has to be done.
A note on translation. All Clausewitz quotations are from the 1873 English translation by Colonel J. J. Graham, public domain via Project Gutenberg #1946. Citations follow Bk. I, Ch. III (Book One, Chapter Three).
The Three Sources of Uncertainty
Clausewitz was not vague about where uncertainty comes from. He named three sources, and the German vocabulary is worth keeping because each word carries an operational distinction the translations lose.
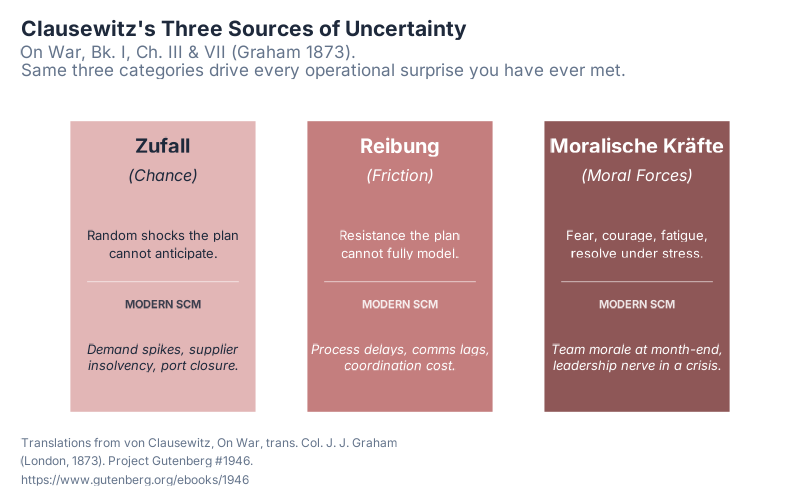
Zufall — chance — is the random shock the plan never modelled: a port closure, a supplier insolvency, a competitor’s surprise launch. Reibung — friction, the subject of last week’s article — is the resistance the plan cannot fully model even when nothing surprising happens. Moralische Kräfte — moral forces — is the human variable: fear, fatigue, the team’s resolve at the end of a long quarter, the leader’s nerve when the plan visibly stops working.
Modern risk management handles the first category badly and the other two not at all. The standard risk register tabulates Zufall with probabilities and impacts and calls the result a forecast. Reibung and Moralische Kräfte are not on the register, because they are not random variables with measurable distributions. They are what the economist Frank Knight called uncertainty in 1921 — the irreducible kind that does not collapse into an expected value no matter how many simulations you run. Clausewitz had named all three a century earlier, and drawn the obvious conclusion: the strategist who treats uncertainty as a calculation problem is solving the wrong problem.
Coup d’Oeil: The Stroke of the Eye
Clausewitz’s word for the quality that lets a commander act inside this fog is coup d’oeil — French, literally “stroke of the eye.” It has been romanticised into mysticism, which is the opposite of what he meant:
“By this expression is meant the rapid discovery of a truth, which to the ordinary mind is either not visible at all or only becomes so after long examination and reflection.”
— On War, Bk. I, Ch. III (Graham 1873)
He adds in the same chapter that “it is, therefore, not only the physical, but more frequently the mental eye which is meant” — locating the faculty firmly inside trained cognition, not magic.
Two centuries later, the cognitive scientist Gary Klein measured this exact thing.
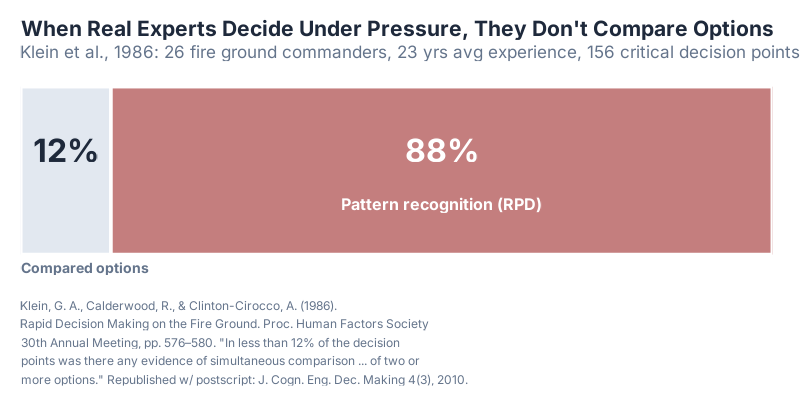
Klein, Calderwood, and Clinton-Cirocco’s 1986 study of fire-ground commanders probed twenty-six commanders, mean twenty-three years of experience, across one hundred fifty-six critical decision points. The headline finding, in Klein’s exact words: “In less than 12% [of the decision points] was there any evidence of simultaneous comparisons of two or more options.” The remaining decisions — roughly eighty-eight per cent — were made by recognising a pattern and acting on it. Klein called this Recognition-Primed Decision-making (RPD), and it is the empirical face of coup d’oeil: trained expert pattern recognition, not deliberation.
Note the words trained and expert. Twenty-three years was not incidental.
Fingerspitzengefühl: Fingertip Feel
The German military tradition later gave this faculty a second, more tactile name: Fingerspitzengefühl — fingertip feel. The word is not Clausewitz’s — it enters doctrine in the Moltke-to-Guderian era and has since migrated into civilian leadership writing — but the concept sits squarely inside what he was describing: the trained capacity to read a situation through the texture of small signals (a customer’s hesitation, a supplier’s tone, a number that is almost right but not quite) and act on the read before it can be articulated.
It is tempting to reach for Daniel Kahneman’s System 1 here, and the connection is real but partial. Kahneman’s System 1 is the default cognitive system: fast, available to everyone, frequently wrong. Fingerspitzengefühl is the opposite of default. It is System 1 trained over years of consequential exposure, calibrated by feedback from real outcomes, pruned of the heuristics that did not survive contact with reality. Klein and Kahneman, in their joint 2009 paper, agreed on the conditions for trustworthy intuition: a regular environment that gives feedback, and prolonged practice inside it.
That is the difference between fingertip feel and a hunch. The hunch is free. The feel costs about a decade.
The Danger of Analysis Paralysis
If trained intuition is the asset, the reflex to delay decisions until “the data is in” is its mirror image — the liability. Most modern organisations have institutionalised the reflex.
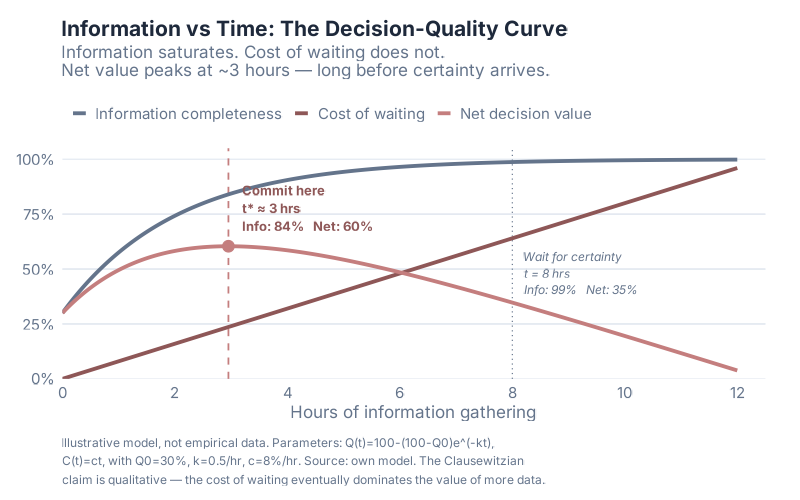
The chart is a parametric, illustrative model — labelled as such on the figure. Information completeness rises and saturates (grey). The cost of waiting rises linearly and does not (dark red). Net decision value is the difference (red). With illustrative parameters, the optimum lands at t* ≈ 3 hours, where information is about 84% complete and net value peaks near 60%. Wait until certainty — say eight hours — and information completeness reaches 99%, but net value collapses to about 35%. The “wait for certainty” commander pays roughly twenty-five percentage points of net outcome for the comfort of being right slightly later than it mattered.
The numbers are illustrative; the geometry is not. The cost-of-waiting line does not flatten. The information line does. Once those two truths are in front of you, the strategic question is no longer “do we have enough data?” but “does the marginal hour of analysis still buy more than it costs?” In most rooms, that question is never asked, and the answer is silently no for several hours before anyone notices.
This is what Clausewitz warned about when he wrote that “a great part of the information obtained in War is contradictory, a still greater part is false, and by far the greatest part is of a doubtful character” (Bk. I, Ch. VI). More data does not, past a point, produce a clearer picture. It produces a noisier one.
Building Judgment: What Clausewitz Would Say to an MBA Class
Clausewitz served as administrative director of the Prussian Kriegsakademie from 1818 to 1830 (the institution itself was founded in 1810 by Scharnhorst). He did not believe judgment could be conferred by a curriculum. He believed it could only be built, and that the building material was real-consequence experience.
A modern MBA programme is an unparalleled introduction to the vocabulary of strategy: frameworks, cases, models, the names of the consultants who taught the room before you got there. What it cannot deliver — because no two-year credential can — is the calibration that comes from making consequential decisions, watching them turn out badly, and being the person who has to explain why. That calibration is what Clausewitz called coup d’oeil, what the German tradition called Fingerspitzengefühl, and what Klein measured, twenty-three years deep, in his fire-ground commanders.
The honest message to an MBA classroom is therefore not the framework will save you. It is: the framework is the scaffolding; the judgment is built by climbing it under load, repeatedly, with witnesses. Clausewitz called this presence of mind — “a great conquest over the unexpected” (Bk. I, Ch. III) — and noted, drily, that it cannot be acquired in advance of the unexpected itself.
What to do this week (head-of-strategy edition):
- Audit the last decision your team escalated for “more data.” Was the marginal information actually decision-relevant, or was the request a way of postponing accountability?
- Find your firm’s Klein commanders. When something breaks at 3pm Tuesday, who recognises the pattern and acts inside the hour? Are they on the strategy distribution list, or two layers below it? Write the names down.
- Set a “commit-by” time on every open strategy question. Not a deadline for a deck — a deadline for a decision. The cost-of-waiting line is invisible until you start measuring it.
- Stop calling untrained intuition “judgment.” Judgment is trained pattern recognition with a track record. Calibrate yours by writing predictions down before the outcome and reviewing them after — Tetlock’s discipline, Clausewitz’s purpose.
Friction is what the strategist cannot eliminate. Fog is what the strategist cannot see. Judgment is what the strategist builds — slowly, expensively, on purpose — to act inside both.
Interactive Dashboard
The decision-quality curve makes a clean argument on paper. It makes a sharper one when you can move the parameters yourself — change the cost of waiting, change the information saturation rate, change the baseline awareness, and watch the optimal commit time slide along the x-axis. The interactive version lets you test the geometry against your own organisation’s tempo in five minutes.
Interactive Dashboard
Explore the data yourself — adjust parameters and see the results update in real time.
Show R Code
# =============================================================================
# generate_fog_of_war_images.R
# Charts for "Fog of War, Fog of Market: Decision-Making Under Uncertainty"
# Article 6 of 15 — Strategy That Lasts series (May 2026)
# =============================================================================
#
# This article is a Clausewitz framework piece. Three figures, in order:
#   1. fog_decision_quality_curve.png  (main, 800x500)
#       Information-vs-time decision quality + cost of waiting + net value.
#       Illustrative parametric model. Optimal commit point at ~3 hours.
#   2. fog_klein_rpd.png                (supporting, 800x400)
#       Klein, Calderwood & Clinton-Cirocco 1986 firefighter study —
#       primary-source numbers: 26 commanders, 23 yrs avg experience,
#       156 decision points, <12% used option comparison.
#   3. fog_three_uncertainties.png      (supporting, 800x500)
#       Clausewitz's tripartite uncertainty: Zufall / Reibung / Moralische
#       Kraefte — with their modern SCM equivalents.
#
# Translation locked: GRAHAM (1873), public-domain. Same as Article 5.
#   https://www.gutenberg.org/ebooks/1946
#   Mirror w/ chapter anchors: https://clausewitzstudies.org/readings/OnWar1873/
#
# Colour BRAND-LOCKED: #C47E7E dusty red (Clausewitz Article 6).
# Brand primary remains #0073aa.
# =============================================================================

suppressPackageStartupMessages({
  library(ggplot2)
  library(dplyr)
  library(tidyr)
  library(scales)
  library(patchwork)
})

source("Scripts/theme_inphronesys.R")

# Match showtext rendering DPI to ggsave's dpi=100 so text width metrics
# (used by ggplot for layout) line up with the bitmap render. Without this,
# Inter rendered via showtext at default 96 dpi is wider than ggplot's
# estimator assumes — subtitles and inline labels overflow the panel.
showtext::showtext_opts(dpi = 100)

# Article 6 brand-locked accent (do NOT swap for iron-blue Article 5 used)
clausewitz_red      <- "#C47E7E"
clausewitz_red_dark <- "#8E5757"
clausewitz_red_lite <- "#E2B6B6"

dir.create("Images", showWarnings = FALSE)

# =============================================================================
# CHART 1 — Information vs Time: The Decision-Quality Curve
# =============================================================================
# Parametric, illustrative model — labelled as such on the chart.
#
# Q(t) = baseline Q0 plus saturating information gain
#        Q(t) = 100 - (100 - Q0) * exp(-k * t)
# C(t) = cost of waiting (window-closing penalty), linear
#        C(t) = c * t
# V(t) = expected decision value = Q(t) - C(t)
#
# Parameters chosen so the optimal commit point lands at ~3 hours, at which
# information is ~84% complete but net value peaks at ~60%. The "wait for
# certainty" commander at t=8 has 99% information but only ~35% net value.
# Numbers are explicit in the script; flagged "illustrative" in the caption.
# =============================================================================

# Lock the parameters; downstream agents quote these exact values.
Q0 <- 30          # baseline situational awareness, %
k  <- 0.5         # information saturation rate, per hour
c_ <- 8           # cost of waiting, % per hour

t_seq <- seq(0, 12, by = 0.05)
curve_df <- tibble::tibble(
  t = t_seq,
  Q = 100 - (100 - Q0) * exp(-k * t),
  C = c_ * t,
  V = Q - C
)

# Closed-form optimum: V'(t) = (100 - Q0) * k * exp(-k * t) - c = 0
# => t* = -log(c / ((100 - Q0) * k)) / k
t_star <- -log(c_ / ((100 - Q0) * k)) / k                 # 2.946...
Q_star <- 100 - (100 - Q0) * exp(-k * t_star)             # 84.0
C_star <- c_ * t_star                                     # 23.6
V_star <- Q_star - C_star                                 # 60.4

# Comparison anchor point: "wait for certainty"
t_late <- 8
Q_late <- 100 - (100 - Q0) * exp(-k * t_late)             # 98.7
C_late <- c_ * t_late                                     # 64.0
V_late <- Q_late - C_late                                 # 34.7

# Long-form data for the three curves
plot_df <- curve_df |>
  pivot_longer(cols = c(Q, C, V),
               names_to = "series", values_to = "value") |>
  mutate(series = factor(series,
                         levels = c("Q", "C", "V"),
                         labels = c("Information completeness",
                                    "Cost of waiting",
                                    "Net decision value")))

series_colors <- c(
  "Information completeness" = iph_colors$grey,
  "Cost of waiting"          = clausewitz_red_dark,
  "Net decision value"       = clausewitz_red
)

p1 <- ggplot(plot_df, aes(x = t, y = value, color = series, linetype = series)) +
  geom_hline(yintercept = c(25, 50, 75), color = iph_colors$lightgrey,
             linewidth = 0.4) +
  geom_vline(xintercept = t_star, color = clausewitz_red,
             linewidth = 0.6, linetype = "dashed") +
  geom_vline(xintercept = t_late, color = iph_colors$grey,
             linewidth = 0.4, linetype = "dotted") +
  geom_line(linewidth = 1.3) +
  geom_point(data = data.frame(t = t_star, value = V_star,
                               series = "Net decision value"),
             aes(x = t, y = value), inherit.aes = FALSE,
             size = 3.5, color = clausewitz_red) +
  annotate("text", x = t_star + 0.25, y = V_star + 7,
           label = paste0("Commit here\nt* ≈ ", round(t_star, 1),
                          " hrs\nInfo: ", round(Q_star), "%   Net: ",
                          round(V_star), "%"),
           hjust = 0, vjust = 0, family = "Inter", fontface = "bold",
           size = 3.4, color = clausewitz_red_dark, lineheight = 1.1) +
  annotate("text", x = t_late + 0.2, y = V_late + 4,
           label = paste0("Wait for certainty\nt = ", t_late,
                          " hrs\nInfo: ", round(Q_late), "%   Net: ",
                          round(V_late), "%"),
           hjust = 0, vjust = 0, family = "Inter", fontface = "italic",
           size = 3.1, color = iph_colors$grey, lineheight = 1.1) +
  scale_color_manual(values = series_colors) +
  scale_x_continuous(breaks = seq(0, 12, 2),
                     limits = c(0, 12.5),
                     expand = c(0, 0)) +
  scale_y_continuous(labels = function(x) paste0(x, "%"),
                     limits = c(0, 105),
                     breaks = seq(0, 100, 25),
                     expand = c(0, 0)) +
  labs(
    title = "Information vs Time: The Decision-Quality Curve",
    subtitle = paste0(
      "Information saturates. Cost of waiting does not.\n",
      "Net value peaks at ~", round(t_star, 1),
      " hours — long before certainty arrives."
    ),
    x = "Hours of information gathering",
    y = NULL,
    color = NULL,
    linetype = NULL,
    caption = paste(
      "Illustrative model, not empirical data. Parameters: Q(t)=100-(100-Q0)e^(-kt),",
      "C(t)=ct, with Q0=30%, k=0.5/hr, c=8%/hr. Source: own model. The Clausewitzian",
      "claim is qualitative — the cost of waiting eventually dominates the value of more data.",
      sep = "\n"
    )
  ) +
  theme_inphronesys(grid = "y") +
  theme(
    legend.position = "top",
    legend.justification = "left",
    plot.caption = element_text(lineheight = 1.3, hjust = 0,
                                color = iph_colors$grey, size = 8.5,
                                margin = margin(t = 12)),
    plot.margin = margin(15, 25, 10, 10)
  )

ggsave("https://inphronesys.com/wp-content/uploads/2026/05/fog_decision_quality_curve-1.png", p1,
       width = 8, height = 5, dpi = 100, bg = "white")

# =============================================================================
# CHART 2 — Klein 1986: How Real Experts Decide Under Pressure
# =============================================================================
# Primary-source numbers from Klein, Calderwood & Clinton-Cirocco (1986),
# "Rapid Decision Making on the Fire Ground", Proceedings of the Human Factors
# Society 30th Annual Meeting, pp. 576-580. Postscript republished 2010 in
# Journal of Cognitive Engineering and Decision Making 4(3): 186-209.
#
# Source: 26 fire ground commanders, mean 23 years' experience,
#         156 decision points probed.
# Finding: in *less than 12%* of decision points was there any evidence of
#          simultaneous comparison of two or more options. The remaining
#          ~88% relied on pattern recognition (Recognition-Primed Decision).
# =============================================================================

klein_df <- tibble::tibble(
  mode = c("Pattern recognition (RPD)", "Compared options"),
  pct  = c(88, 12),
  n    = c(137, 19)   # 156 * 0.88 ~ 137; <12% ~ 19
)

klein_df$mode <- factor(klein_df$mode,
                         levels = c("Compared options",
                                    "Pattern recognition (RPD)"))

klein_df <- klein_df |>
  arrange(mode) |>
  mutate(
    end   = cumsum(pct),
    start = end - pct,
    mid   = (start + end) / 2
  )

p2 <- ggplot(klein_df) +
  geom_rect(aes(xmin = start, xmax = end, ymin = 0, ymax = 1, fill = mode),
            color = "white", linewidth = 1.2) +
  # Big % numbers — both centered inside their segments
  geom_text(aes(x = mid, y = 0.62,
                label = paste0(pct, "%"),
                color = mode),
            family = "Inter", fontface = "bold", size = 8) +
  # Mode label for the LARGE segment (RPD, 88%) — fits inside, white on red
  geom_text(data = subset(klein_df, mode == "Pattern recognition (RPD)"),
            aes(x = mid, y = 0.30, label = mode, color = mode),
            family = "Inter", fontface = "bold", size = 4) +
  # Mode label for the SMALL segment (12%) — placed BELOW the bar AND
  # left-anchored to x=0 so the label can extend rightward without being
  # clipped at the panel edge.
  geom_text(data = subset(klein_df, mode == "Compared options"),
            aes(y = -0.08, label = mode),
            x = 0,
            color = iph_colors$grey,
            family = "Inter", fontface = "bold", size = 3.5,
            hjust = 0) +
  scale_fill_manual(values = c(
    "Compared options"            = iph_colors$lightgrey,
    "Pattern recognition (RPD)"   = clausewitz_red
  )) +
  scale_color_manual(values = c(
    "Compared options"            = iph_colors$dark,
    "Pattern recognition (RPD)"   = "white"
  )) +
  scale_x_continuous(limits = c(0, 100), expand = c(0, 0),
                     breaks = NULL) +
  scale_y_continuous(limits = c(-0.18, 1.05), expand = c(0, 0),
                     breaks = NULL) +
  labs(
    title = "When Real Experts Decide Under Pressure, They Don't Compare Options",
    subtitle = paste0(
      "Klein et al., 1986: 26 fire ground commanders, 23 yrs avg experience, ",
      "156 critical decision points."
    ),
    caption = paste(
      "Klein, G. A., Calderwood, R., & Clinton-Cirocco, A. (1986).",
      "Rapid Decision Making on the Fire Ground. Proc. Human Factors Society",
      "30th Annual Meeting, pp. 576–580. \"In less than 12% of the decision",
      "points was there any evidence of simultaneous comparison ... of two or",
      "more options.\" Republished w/ postscript: J. Cogn. Eng. Dec. Making 4(3), 2010.",
      sep = "\n"
    )
  ) +
  theme_inphronesys(grid = "none") +
  theme(
    legend.position = "none",
    axis.title = element_blank(),
    axis.text  = element_blank(),
    panel.grid = element_blank(),
    plot.caption = element_text(lineheight = 1.3, hjust = 0,
                                color = iph_colors$grey, size = 8.5,
                                margin = margin(t = 12)),
    plot.margin = margin(15, 20, 10, 15)
  )

ggsave("https://inphronesys.com/wp-content/uploads/2026/05/fog_klein_rpd-1.png", p2,
       width = 8, height = 4, dpi = 100, bg = "white")

# =============================================================================
# CHART 3 — Clausewitz's Tripartite Uncertainty
# =============================================================================
# Three sources of uncertainty in war, mapped to modern supply-chain analogues.
# A side-by-side card layout — pure ggplot tiles + labels, no inline SVG.
# =============================================================================

three_unc <- tibble::tibble(
  x          = c(1, 2, 3),
  german     = c("Zufall",
                 "Reibung",
                 "Moralische Kräfte"),     # fits at size 5 (see geom_text below)
  english    = c("Chance",
                 "Friction",
                 "Moral Forces"),
  # Pre-wrapped to fit the 0.8-unit-wide cards at size 3.4 Inter
  desc       = c("Random shocks the plan\ncannot anticipate.",
                 "Resistance the plan\ncannot fully model.",
                 "Fear, courage, fatigue,\nresolve under stress."),
  scm_label  = c("Supply chain analogue",
                 "Supply chain analogue",
                 "Supply chain analogue"),
  scm        = c("Demand spikes, supplier\ninsolvency, port closure.",
                 "Process delays, comms lags,\ncoordination cost.",
                 "Team morale at month-end,\nleadership nerve in a crisis.")
)

card_fill <- c(clausewitz_red_lite, clausewitz_red, clausewitz_red_dark)
text_col  <- c(iph_colors$dark, "white", "white")

three_unc$fill       <- card_fill
three_unc$text_color <- text_col

p3 <- ggplot(three_unc) +
  geom_rect(aes(xmin = x - 0.4, xmax = x + 0.4,
                ymin = 0.3, ymax = 4.2,
                fill = fill),
            color = "white", linewidth = 1.5) +
  scale_fill_identity() +
  # German term (top, large, bold) — size 5 so "Moralische Kräfte" fits the card
  geom_text(aes(x = x, y = 3.85, label = german, color = text_color),
            family = "Inter", fontface = "bold", size = 5) +
  geom_text(aes(x = x, y = 3.45, label = paste0("(", english, ")"),
                color = text_color),
            family = "Inter", fontface = "italic", size = 4) +
  geom_text(aes(x = x, y = 2.55, label = desc, color = text_color),
            family = "Inter", size = 3.4, lineheight = 1.1) +
  geom_segment(aes(x = x - 0.32, xend = x + 0.32, y = 2.05, yend = 2.05),
               color = "white", linewidth = 0.4, alpha = 0.5) +
  geom_text(aes(x = x, y = 1.75,
                label = toupper("Modern SCM"),
                color = text_color),
            family = "Inter", fontface = "bold", size = 2.8, alpha = 0.85) +
  geom_text(aes(x = x, y = 1.05, label = scm, color = text_color),
            family = "Inter", fontface = "italic", size = 3.2,
            lineheight = 1.1) +
  scale_color_identity() +
  scale_x_continuous(limits = c(0.4, 3.6), expand = c(0, 0)) +
  scale_y_continuous(limits = c(0.2, 4.5), expand = c(0, 0)) +
  labs(
    title = "Clausewitz's Three Sources of Uncertainty",
    subtitle = paste0(
      "On War, Bk. I, Ch. III & VII (Graham 1873).\n",
      "Same three categories drive every operational surprise you have ever met."
    ),
    caption = paste(
      "Translations from von Clausewitz, On War, trans. Col. J. J. Graham",
      "(London, 1873). Project Gutenberg #1946.",
      "https://www.gutenberg.org/ebooks/1946",
      sep = "\n"
    )
  ) +
  theme_inphronesys(grid = "none") +
  theme(
    axis.title = element_blank(),
    axis.text  = element_blank(),
    panel.grid = element_blank(),
    plot.caption = element_text(lineheight = 1.3, hjust = 0,
                                color = iph_colors$grey, size = 8.5,
                                margin = margin(t = 12)),
    plot.margin = margin(15, 15, 10, 15)
  )

ggsave("https://inphronesys.com/wp-content/uploads/2026/05/fog_three_uncertainties-1.png", p3,
       width = 8, height = 5, dpi = 100, bg = "white")
References
- Clausewitz, Carl von. On War (Vom Kriege), Book I, Chapters III (“On Military Genius”) and VI (“Information in War”). Translated by Col. J. J. Graham (London: N. Trübner & Co., 1873). Public domain. Project Gutenberg #1946. https://www.gutenberg.org/ebooks/1946. Chapter-anchored mirror: https://clausewitzstudies.org/readings/OnWar1873/.
- Klein, Gary A., Roberta Calderwood, and Anne Clinton-Cirocco. “Rapid Decision Making on the Fire Ground.” Proceedings of the Human Factors Society 30th Annual Meeting, vol. 30, no. 6, 1986, pp. 576–580. https://journals.sagepub.com/doi/10.1177/154193128603000616. Republished with postscript in Journal of Cognitive Engineering and Decision Making 4(3), 2010, pp. 186–209. https://journals.sagepub.com/doi/abs/10.1518/155534310X12844000801203
- Klein, Gary A. Sources of Power: How People Make Decisions. Cambridge, MA: MIT Press, 1998. ISBN 978-0-262-61146-6. https://mitpress.mit.edu/9780262611466/sources-of-power/
- Kahneman, Daniel. Thinking, Fast and Slow. New York: Farrar, Straus and Giroux, 2011. ISBN 978-0-374-27563-1.
- Kahneman, Daniel, and Gary Klein. “Conditions for Intuitive Expertise: A Failure to Disagree.” American Psychologist 64(6), 2009, pp. 515–526.
- Knight, Frank H. Risk, Uncertainty, and Profit. Boston: Houghton Mifflin, 1921. [Original source of the risk/uncertainty distinction.]
- Tetlock, Philip E., and Dan Gardner. Superforecasting: The Art and Science of Prediction. New York: Crown, 2015. ISBN 978-0-8041-3669-3.
- Articles 1–5 in this series — Strategy That Lasts: The Classics, May 2026, on inphronesys.com.
Leave a Reply