Fourteen workstreams. Eight initiatives. Three “horizons.” Each gets a colour-coded box, each gets a sponsor, each gets a slice of the year. Nothing gets enough to actually win at, but everything gets something — because cutting an initiative is a meeting nobody in the room wants to host.
Clausewitz had a word for the result. He called it diffusion. He did not mean it as a description. He meant it as a verdict.
“There is no more imperative and simpler law for strategy than to keep the forces concentrated.”
— Carl von Clausewitz, On War, Bk. III, Ch. XI, trans. Col. J. J. Graham (1873)
Two centuries later, the part of his thinking least absorbed by the modern strategy curriculum is also the most operational thing he wrote. It is not “know your enemy” — that was Sun Tzu. It is not “judgment under uncertainty” — article on the fog of market covered that. It is Schwerpunkt: the discipline of concentrating everything that matters at the place where the matter is decided. (As in Articles 5 and 6, all Clausewitz quotations are from the 1873 Graham translation, public domain via Project Gutenberg #1946.)
Two Concepts, One Principle
English readers usually hear “centre of gravity,” nod, and move on. The German military tradition that descended from Clausewitz keeps two distinct words for what English collapses into one, and the difference is operational.
Schwerpunkt — point of main effort — is about your focus. It is the place where you choose to mass your forces, your capital, your attention. It is a decision you make.
Zentrum der Kraft — centre of gravity — is about your opponent’s focus. It is the node on which their position depends. It is a discovery you make.
Conflating the two is how strategy decks end up “focused” on a goal that is not the same thing as the place that decides whether the goal can be reached. Clausewitz’s instruction is clean and short. The Book III, Chapter XI version is at the top of this article. He repeats it in the same chapter in the form of a positive principle: “The best strategy is always to be very strong, first generally, then at the decisive point.” Print those two sentences on the wall.
Identifying the Enemy’s Center of Gravity
In Book VIII, Clausewitz gives the same idea a more physical metaphor — gravitational, almost mechanical:
“Out of them a certain centre of gravity, a centre of power and movement, will form itself, on which everything depends; and against this centre of gravity of the enemy, the concentrated blow of all the forces must be directed.”
— On War, Bk. VIII, Ch. IV (Graham 1873)
The analytical work for the modern strategist is to find that node. In a competitor’s position it might be a single regulatory licence, a sticky distribution channel, a key talent cluster, an installed base of customers whose switching costs are higher than the next quarter’s marketing budget. None of these are the same as “their revenue” or “their market share” — those are outputs. The centre of gravity is the input without which the outputs collapse.
A clean test: name the single node that, if it failed for the competitor on a Tuesday, would force them to change their strategy by Friday. If you can name that node, you have located their Zentrum der Kraft. If you cannot, you do not yet have a strategy.
The Corporate Schwerpunkt Failure Mode
The same arithmetic that breaks military diffusion breaks corporate diffusion. Before any specific allocation profile, look at the master geometry. Sweep allocation policy from uniform diffusion through Schwerpunkt to winner-take-all, plot expected outcome against the HHI concentration index (the Herfindahl–Hirschman Index — the sum of squared allocation shares; ~0.10 for uniform diffusion across ten initiatives, 1.0 for pure focus on one), and the curve looks like this. The engine matches real strategic capital: a saturating-returns base above an $8M activation threshold (you cannot half-build a market entry), plus a smooth dominance bonus phasing in around $50M (network effects, momentum, reputation reward clear leaders). Numbers are illustrative — the geometry is not.
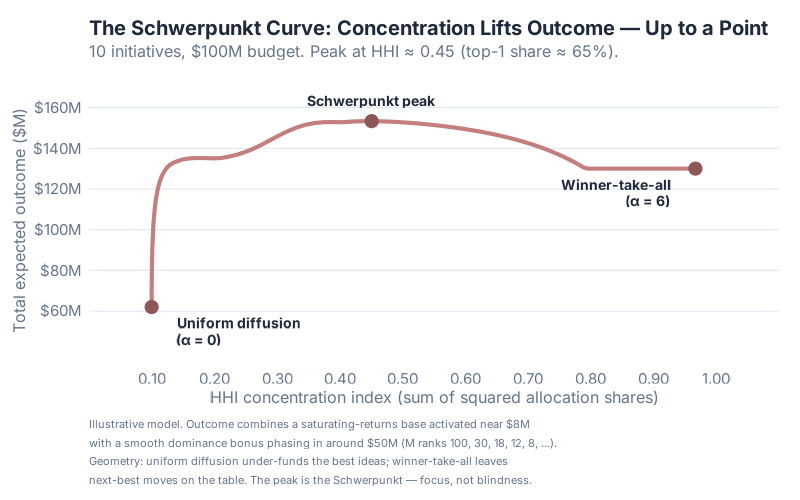
The curve rises sharply off uniform diffusion (HHI 0.10, ~$62M expected outcome), peaks at the Schwerpunkt (HHI ≈ 0.45, top-1 share ~64%, ~$153M — roughly 2.5× the diffuse outcome on the same dollars), then falls back: pushing all the way to winner-take-all (HHI 0.97, $130M) leaves the outcome about 18% below the Schwerpunkt peak. Schwerpunkt is focus, not blindness. The dominant line gets the lion’s share. The supporting line still gets enough to matter. The fourteenth workstream gets its budget cancelled and is told why.
Apply the same engine to four discrete allocation profiles and the failure modes get their names.
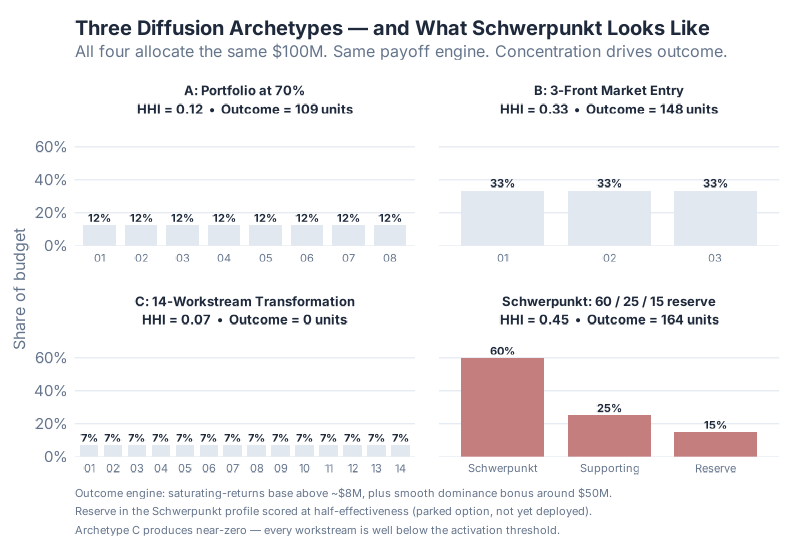
Archetype A — the portfolio company funding everything at 70%. Eight initiatives, $12.5M each, HHI 0.13. Every initiative crosses the activation threshold, but none reaches the dominance bonus. Outcome: 108.6 illustrative units. This is the profile that gets defended in every budget meeting as “diversification.” The chart says it is leaving most of the upside on the table.
Archetype B — the three-front market entrant. Three markets, $33.3M each. Better. HHI 0.33. Outcome: 147.7. Concentration is paying. But still no single front is over the dominance threshold.
Archetype C — the 14-workstream transformation. Fourteen workstreams, ~$7.1M each. HHI 0.07. Outcome: 0. Every workstream sits below the $8M activation threshold. The transformation produces nothing. This is not a worst-case toy example; it is a recurring pattern. The PowerPoint says fourteen workstreams. The arithmetic says zero.
Schwerpunkt — 60 / 25 / 15 with the 15 held in reserve. Three lines: a dominant initiative funded over the dominance threshold, a supporting initiative funded over the activation threshold, and a reserve parked as an option. HHI 0.45. Outcome: 163.5 — even with the reserve scored at half-effectiveness, because it is not yet deployed.
The Schwerpunkt profile beats the diffusion archetypes not because of a clever optimisation. It beats them because it is the only profile that has put a single line over the dominance threshold and refused to apologise for it.
The Role of Reserves
The reserve is the line that almost every modern allocation conversation gets backwards. Reserves are not a hedge against failure. They are the instrument of exploitation.
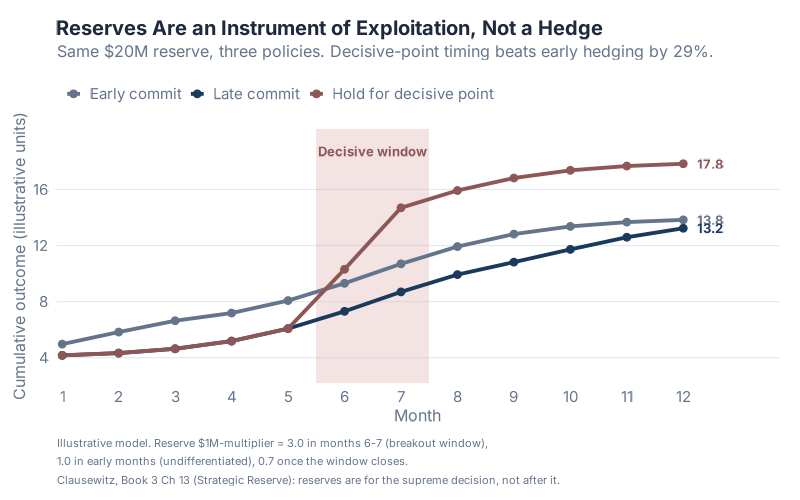
The chart above runs the same campaign three times with the same $20M reserve under three policies.
- Spend it early — months 1-3, before the situation has resolved itself — and the campaign ends at 13.83 illustrative units. The reserve was committed before there was anything decisive to commit it to.
- Spend it late — months 10-12, once the decisive window has closed — and the campaign ends at 13.23. The money was, in the most literal sense, late.
- Hold it for the decisive point — months 6-7, when one initiative breaks out and shows asymmetric returns on additional capital — and the campaign ends at 17.83. Same money. +29% over early commit. +35% over late commit.
The corporate translation is uncomfortable. Most “reserve” capital is held to absorb shortfalls — a hedge against the plan being wrong. That is risk management, not strategy. The Clausewitzian reserve is held to be deployed into success: the moment one product line, one geography, one customer relationship is breaking out is the moment to put the next $20M behind it. The strategist who has already spent the reserve cannot exploit the breakout. The strategist still holding it past month nine has missed the window.
Applying Schwerpunkt to the Annual Strategy Cycle
Three questions for the next planning cycle. Richard Rumelt’s Good Strategy / Bad Strategy (2011) calls the modern equivalent the “kernel of strategy” — diagnosis, guiding policy, coherent actions. The Clausewitzian phrasing is older and shorter:
1. Where is the decisive ground? Not the largest market. Not the loudest customer. The single position whose dominance changes the structure of the next two years. A strategy document that names none has, geometrically, defaulted to the average of all positions — the left edge of the Schwerpunkt curve, where the outcome is lowest.
2. What would it take to dominate there? Not “make progress.” Not “invest.” Dominate. The dominance bonus phases in around $50M for a reason: below it, the second-mover catches you on the way down. Name the threshold honestly. If you cannot afford it, you have not yet found your Schwerpunkt — keep looking.
3. What are we willing to stop doing? The question that dies in most strategy reviews because nobody wants to be the executive who killed the workstream. Fourteen workstreams at $7.1M each produce zero. Three at $33M each produce 148. Concentration costs cuts — and cuts cost meetings — but the alternative is a plan whose budget arithmetic has already pre-decided to fail.
If your strategy doc lists fourteen workstreams, you don’t have a strategy. You have a budget.
A strategy that survives those three questions is not guaranteed to win. Nothing in Clausewitz is. But it is the only kind of strategy that has stopped being arithmetic and started being a decision.
Thursday we leave Clausewitz for a swordsman. Article 8 — The Way of Strategy: What a 17th-Century Swordsman Knew About Mastery, Thursday May 14. From organisational concentration to individual mastery; from the boardroom to the dojo.
Interactive Dashboard
The Schwerpunkt curve makes a clean argument on paper. It makes a sharper one when you can move the parameters yourself — drag the allocation across ten initiatives, change the activation and dominance thresholds, and watch the HHI concentration index slide along the x-axis with the outcome shifting in real time. The interactive version lets you score your own organisation’s allocation against the geometry in five minutes.
Interactive Dashboard
Explore the data yourself — adjust parameters and see the results update in real time.
Show R Code
# =============================================================================
# generate_schwerpunkt_images.R
# Charts for "Schwerpunkt: The Lost Art of Strategic Concentration"
# Article 7 of 15 — Strategy That Lasts series (May 2026)
# =============================================================================
#
# Models Clausewitz's principle of strategic concentration as applied to
# corporate resource allocation. Three illustrative datasets:
#
#   1. Concentration-vs-outcome curve (sweep allocation policy from uniform
#      diffusion to Schwerpunkt, on a saturating-returns engine with both a
#      threshold cost and a dominance bonus).
#   2. Three corporate diffusion archetypes (portfolio at 70%, 3-front market
#      entry, 14-workstream transformation) plus the Schwerpunkt counter.
#   3. Reserves timing — early commit / late commit / hold-for-decisive-point.
#
# All numbers are illustrative — the point is the geometry of concentration,
# not empirical claims about specific companies.
#
# OUTCOME ENGINE (used in datasets 1 + 2):
#   outcome_i(a_i) = M_i * (1 - exp(-(a_i - threshold) / scale)) * (a_i >= threshold)
#                  + dominance_bonus_i
#   where dominance_bonus_i = bonus_frac * M_i  if a_i >= bonus_threshold else 0
#
#   Numbers locked at: threshold = 8, scale = 5, bonus_threshold = 50,
#                      bonus_frac = 0.3.
#
# Output files (all bg='white', dpi=100, 800px wide):
#   https://inphronesys.com/wp-content/uploads/2026/05/sch_concentration_outcome_curve.png  (800x500)
#   https://inphronesys.com/wp-content/uploads/2026/05/sch_three_archetypes.png             (800x550)
#   https://inphronesys.com/wp-content/uploads/2026/05/sch_reserves_timing.png              (800x500)
#
# Translation locked: GRAHAM (1873), public-domain. Project Gutenberg #1946.
#   https://www.gutenberg.org/ebooks/1946
# Brand-locked Article-7 color: #C47E7E dusty red (decided 2026-05-06).
# Brand primary remains #0073aa.
# =============================================================================

suppressPackageStartupMessages({
  library(ggplot2)
  library(dplyr)
  library(tidyr)
  library(scales)
  library(patchwork)
})

source("Scripts/theme_inphronesys.R")

# -- Brand-locked Schwerpunkt palette (Article 7) ------------------------------
schwerpunkt_red       <- "#C47E7E"   # dusty red — primary
schwerpunkt_red_dark  <- "#8E5757"   # deeper dusty red — emphasis
schwerpunkt_red_lite  <- "#E5C2C2"   # pale dusty red — fill / inactive

# Defensive: ensure Images/ exists
dir.create("Images", showWarnings = FALSE)

set.seed(42)

# =============================================================================
# OUTCOME ENGINE (shared by datasets 1 and 2)
# =============================================================================

THRESHOLD       <- 8     # $M minimum to do anything (fixed cost of attempting)
SCALE           <- 5     # $M saturation parameter
BONUS_CENTER    <- 50    # $M dominance midpoint (smoothed sigmoid)
BONUS_WIDTH     <- 4     # $M sigmoid width — controls smoothness of the bonus
BONUS_FRAC      <- 0.30  # bonus = 30% of M_i fully phased in well past center

# Right-skewed payoff potentials — rank 1 has ~54% of total potential.
# Length 14 so that the 14-workstream archetype can be scored on the same M.
M14 <- c(100, 30, 18, 12, 8, 6, 5, 4, 3, 2, 1.5, 1.2, 1, 0.8)

# Smooth sigmoid for both threshold activation and dominance bonus, so the
# concentration curve has no artificial step discontinuities.
sig <- function(x, center, width) 1 / (1 + exp(-(x - center) / width))

outcome_engine <- function(allocation, M = M14) {
  n  <- min(length(allocation), length(M))
  a  <- allocation[seq_len(n)]
  Mi <- M[seq_len(n)]
  # Base saturating-returns curve, hard-clamped at 0 below the activation threshold
  base  <- Mi * pmax(0, 1 - exp(-(a - THRESHOLD) / SCALE))
  # Smooth dominance bonus that phases in around $50M (avoids step discontinuity)
  bonus <- BONUS_FRAC * Mi * sig(a, BONUS_CENTER, BONUS_WIDTH)
  base + bonus
}

# Convenience: total outcome
total_outcome <- function(allocation, M = M14) sum(outcome_engine(allocation, M))

# =============================================================================
# DATASET 1 — Concentration vs Outcome (Schwerpunkt curve)
# =============================================================================
# 10 strategic initiatives compete for a fixed $100M budget. Allocation by
# rank-weighted policy:  w_i ∝ rank_i^(-alpha)
#   alpha = 0 -> uniform diffusion (all get $10M each)
#   alpha large -> Schwerpunkt / winner-take-all
#
# We sweep alpha and plot total outcome vs HHI concentration index.
# =============================================================================

n_initiatives <- 10
budget        <- 100
M_curve       <- M14[1:n_initiatives]

allocate_by_alpha <- function(alpha, n = n_initiatives, B = budget) {
  ranks  <- 1:n
  raw_w  <- ranks^(-alpha)
  w      <- raw_w / sum(raw_w)
  B * w
}

alpha_grid <- seq(0, 6, by = 0.05)
curve_df <- lapply(alpha_grid, function(a) {
  alloc <- allocate_by_alpha(a)
  tot   <- total_outcome(alloc, M = M_curve)
  shr   <- alloc / budget
  data.frame(
    alpha = a,
    total = tot,
    hhi   = sum(shr^2),
    top1  = max(shr)
  )
}) |> do.call(what = rbind)

peak_idx   <- which.max(curve_df$total)
peak_alpha <- curve_df$alpha[peak_idx]
peak_total <- curve_df$total[peak_idx]
peak_hhi   <- curve_df$hhi[peak_idx]
peak_top1  <- curve_df$top1[peak_idx]

unif_total <- curve_df$total[which.min(abs(curve_df$alpha - 0))]
wta_total  <- curve_df$total[which.min(abs(curve_df$alpha - 6))]
unif_hhi   <- curve_df$hhi[which.min(abs(curve_df$alpha - 0))]
wta_hhi    <- curve_df$hhi[which.min(abs(curve_df$alpha - 6))]

anchors <- data.frame(
  label = c("Uniform diffusion\n(α = 0)",
            "Schwerpunkt peak",
            "Winner-take-all\n(α = 6)"),
  alpha = c(0, peak_alpha, 6),
  total = c(unif_total, peak_total, wta_total),
  hhi   = c(unif_hhi,   peak_hhi,   wta_hhi)
)

p1 <- ggplot(curve_df, aes(x = hhi, y = total)) +
  geom_line(linewidth = 1.4, color = schwerpunkt_red) +
  geom_point(data = anchors, size = 4, color = schwerpunkt_red_dark) +
  geom_text(
    data = anchors,
    aes(label = label),
    nudge_y = c(-12,  10, -12),
    nudge_x = c(0.04, 0,  -0.04),
    hjust   = c(0,    0.5, 1),
    family  = "Inter", size = 3.6, lineheight = 0.95,
    color   = iph_colors$dark, fontface = "bold"
  ) +
  scale_x_continuous(
    labels = number_format(accuracy = 0.01),
    breaks = seq(0.1, 1.0, 0.1),
    limits = c(0.05, 1.05)
  ) +
  scale_y_continuous(
    labels = label_number(suffix = "M", prefix = "
quot;), limits = c(40, max(curve_df$total) * 1.10), breaks = pretty(curve_df$total, n = 6) ) + labs( title = "The Schwerpunkt Curve: Concentration Lifts Outcome — Up to a Point", subtitle = sprintf( "10 initiatives, $100M budget. Peak at HHI ≈ %.2f (top-1 share ≈ %d%%).", peak_hhi, round(100 * peak_top1) ), x = "HHI concentration index (sum of squared allocation shares)", y = "Total expected outcome ($M)", caption = paste( "Illustrative model. Outcome combines a saturating-returns base activated near $8M", "with a smooth dominance bonus phasing in around $50M (M ranks 100, 30, 18, 12, 8, ...).", "Geometry: uniform diffusion under-funds the best ideas; winner-take-all leaves", "next-best moves on the table. The peak is the Schwerpunkt — focus, not blindness.", sep = "\n" ) ) + theme_inphronesys(grid = "y") + theme( plot.caption = element_text(lineheight = 1.3, hjust = 0, color = iph_colors$grey, size = 8.5) ) ggsave("https://inphronesys.com/wp-content/uploads/2026/05/sch_concentration_outcome_curve.png", p1, width = 8, height = 5, dpi = 100, bg = "white") # ============================================================================= # DATASET 2 — Three Corporate Diffusion Archetypes # ============================================================================= # Same payoff engine. Same $100M budget. Four allocation profiles. # ============================================================================= # Archetype A — "Portfolio at 70%": 8 initiatives, each at $12.5M alloc_A <- rep(100/8, 8) # Archetype B — "Three-Front Market Entry": 3 markets, each at $33.3M alloc_B <- rep(100/3, 3) # Archetype C — "14-Workstream Transformation": 14 workstreams, each at ~$7.1M alloc_C <- rep(100/14, 14) # Schwerpunkt — dominant + supporting + reserve. # The reserve ($15M) is parked as an option. We score it at half-effectiveness # in the bar chart's "outcome" number to reflect that it is not yet deployed # (Dataset 3 shows what well-timed reserve deployment looks like). alloc_S_active <- c(60, 25) alloc_S_reserve <- 15 alloc_S_display <- c(60, 25, 15) score_A <- total_outcome(alloc_A, M = M14) score_B <- total_outcome(alloc_B, M = M14) score_C <- total_outcome(alloc_C, M = M14) score_S <- sum(outcome_engine(alloc_S_active, M = M14)) + 0.5 * outcome_engine(c(THRESHOLD, THRESHOLD, alloc_S_reserve), M = M14)[3] hhi_share <- function(x) sum((x/sum(x))^2) hhi_A <- hhi_share(alloc_A) hhi_B <- hhi_share(alloc_B) hhi_C <- hhi_share(alloc_C) hhi_S <- hhi_share(alloc_S_display) archetype_meta <- tibble::tribble( ~archetype, ~score, ~hhi, ~n_init, "A: Portfolio at 70%", score_A, hhi_A, length(alloc_A), "B: 3-Front Market Entry", score_B, hhi_B, length(alloc_B), "C: 14-Workstream Transformation", score_C, hhi_C, length(alloc_C), "Schwerpunkt: 60 / 25 / 15 reserve", score_S, hhi_S, length(alloc_S_display) ) bars_df <- bind_rows( tibble(archetype = "A: Portfolio at 70%", slot = sprintf("%02d", 1:length(alloc_A)), pct = alloc_A), tibble(archetype = "B: 3-Front Market Entry", slot = sprintf("%02d", 1:length(alloc_B)), pct = alloc_B), tibble(archetype = "C: 14-Workstream Transformation", slot = sprintf("%02d", 1:length(alloc_C)), pct = alloc_C), tibble(archetype = "Schwerpunkt: 60 / 25 / 15 reserve", slot = c("Schwerpunkt", "Supporting", "Reserve"), pct = alloc_S_display) ) |> left_join(archetype_meta, by = "archetype") |> mutate( is_schwerpunkt = grepl("^Schwerpunkt", archetype), facet_label = factor( sprintf("%s\nHHI = %.2f • Outcome = %.0f units", archetype, hhi, score), levels = sprintf("%s\nHHI = %.2f • Outcome = %.0f units", archetype_meta$archetype, archetype_meta$hhi, archetype_meta$score) ) ) # Order bars within each facet by allocation (descending) bars_df <- bars_df |> group_by(archetype) |> arrange(desc(pct), .by_group = TRUE) |> mutate(slot = factor(slot, levels = unique(slot))) |> ungroup() p2 <- ggplot(bars_df, aes(x = slot, y = pct, fill = is_schwerpunkt)) + geom_col(width = 0.78) + geom_text(aes(label = ifelse(pct >= 5, paste0(round(pct), "%"), "")), vjust = -0.4, family = "Inter", size = 3.0, color = iph_colors$dark, fontface = "bold") + facet_wrap(~ facet_label, scales = "free_x", ncol = 2) + scale_fill_manual(values = c("TRUE" = schwerpunkt_red, "FALSE" = iph_colors$lightgrey), guide = "none") + scale_y_continuous( labels = label_percent(scale = 1, accuracy = 1), limits = c(0, 75), expand = c(0, 0) ) + labs( title = "Three Diffusion Archetypes — and What Schwerpunkt Looks Like", subtitle = "All four allocate the same $100M. Same payoff engine. Concentration drives outcome.", x = NULL, y = "Share of budget", caption = paste( "Outcome engine: saturating-returns base above ~$8M, plus smooth dominance bonus around $50M.", "Reserve in the Schwerpunkt profile scored at half-effectiveness (parked option, not yet deployed).", "Archetype C produces near-zero — every workstream is well below the activation threshold.", sep = "\n" ) ) + theme_inphronesys(grid = "y") + theme( axis.text.x = element_text(angle = 0, hjust = 0.5, size = 8), strip.text = element_text(face = "bold", size = 10, lineheight = 1.1), panel.spacing = unit(1.2, "lines"), plot.caption = element_text(lineheight = 1.3, hjust = 0, color = iph_colors$grey, size = 8.5) ) ggsave("https://inphronesys.com/wp-content/uploads/2026/05/sch_three_archetypes.png", p2, width = 8, height = 5.5, dpi = 100, bg = "white") # ============================================================================= # DATASET 3 — Reserves Timing # ============================================================================= # 12-month campaign. A "decisive moment" emerges around month 6 when one # initiative breaks out and shows asymmetric returns on additional capital. # # Three reserve-deployment policies (each spends $20M total reserve): # - Early commit: months 1-3 (pre-decision hedging) # - Late commit: months 10-12 (after window closes) # - Decisive point: months 6-7 (exploitation of breakout) # # Reserve $1M time-multiplier: # 1.0 in early months, 3.0 at months 6-7 (peak), trailing off after. # ============================================================================= months <- 1:12 reserve_multiplier <- c( 1.0, 1.0, 1.0, 1.0, 1.2, # months 1-5: pre-decision 3.0, 3.0, # months 6-7: decisive point 1.8, 1.4, # months 8-9: trailing exploitation 0.9, 0.7, 0.6 # months 10-12: closing window ) # Baseline campaign outcome (without reserves) — sigmoid-ish growth base_curve <- 4 + 8 / (1 + exp(-0.7 * (months - 6.5))) # tops out ~12 deploy_early <- c(8, 7, 5, 0, 0, 0, 0, 0, 0, 0, 0, 0) deploy_late <- c(0, 0, 0, 0, 0, 0, 0, 0, 0, 4, 8, 8) deploy_decisive <- c(0, 0, 0, 0, 0, 10, 10, 0, 0, 0, 0, 0) gain <- function(deploy) deploy * reserve_multiplier * 0.10 res_df <- bind_rows( tibble(month = months, policy = "Early commit", deploy = deploy_early, outcome = base_curve + cumsum(gain(deploy_early))), tibble(month = months, policy = "Late commit", deploy = deploy_late, outcome = base_curve + cumsum(gain(deploy_late))), tibble(month = months, policy = "Hold for decisive point", deploy = deploy_decisive, outcome = base_curve + cumsum(gain(deploy_decisive))) ) |> mutate(policy = factor(policy, levels = c("Early commit", "Late commit", "Hold for decisive point"))) end_df <- res_df |> group_by(policy) |> summarise(final = round(last(outcome), 2), .groups = "drop") end_labels <- res_df |> filter(month == max(months)) |> mutate(end_text = sprintf("%.1f", outcome)) decisive_final <- end_df$final[end_df$policy == "Hold for decisive point"] early_final <- end_df$final[end_df$policy == "Early commit"] late_final <- end_df$final[end_df$policy == "Late commit"] uplift_pct <- 100 * (decisive_final / early_final - 1) p3 <- ggplot(res_df, aes(x = month, y = outcome, color = policy, group = policy)) + annotate("rect", xmin = 5.5, xmax = 7.5, ymin = -Inf, ymax = Inf, fill = schwerpunkt_red_lite, alpha = 0.45) + annotate("text", x = 6.5, y = 18.7, label = "Decisive window", family = "Inter", size = 3.4, fontface = "bold", color = schwerpunkt_red_dark) + geom_line(linewidth = 1.3) + geom_point(size = 2.2) + geom_text( data = end_labels, aes(x = month + 0.25, y = outcome, label = end_text, color = policy), hjust = 0, vjust = 0.5, fontface = "bold", size = 3.5, family = "Inter", show.legend = FALSE ) + scale_color_manual(values = c( "Early commit" = iph_colors$grey, "Late commit" = iph_colors$navy, "Hold for decisive point" = schwerpunkt_red_dark )) + scale_x_continuous(breaks = 1:12, limits = c(1, 13.6), expand = c(0, 0.1)) + scale_y_continuous(limits = c(3, 19.5), breaks = seq(4, 18, 4)) + labs( title = "Reserves Are an Instrument of Exploitation, Not a Hedge", subtitle = sprintf( "Same $20M reserve, three policies. Decisive-point timing beats early hedging by %.0f%%.", uplift_pct ), x = "Month", y = "Cumulative outcome (illustrative units)", color = NULL, caption = paste( "Illustrative model. Reserve $1M-multiplier = 3.0 in months 6-7 (breakout window),", "1.0 in early months (undifferentiated), 0.7 once the window closes.", "Clausewitz, Book 3 Ch 12: reserves should be deployed where they decide the matter.", sep = "\n" ) ) + theme_inphronesys(grid = "y") + theme( legend.position = "top", legend.justification = "left", plot.caption = element_text(lineheight = 1.3, hjust = 0, color = iph_colors$grey, size = 8.5) ) ggsave("https://inphronesys.com/wp-content/uploads/2026/05/sch_reserves_timing.png", p3, width = 8, height = 5, dpi = 100, bg = "white") References
- Clausewitz, Carl von. On War (Vom Kriege), Book III Chapter XI (“Assembly of Forces in Space”) and Book VIII Chapter IV (“Ends in War More Precisely Defined — Overthrow of the Enemy”). Translated by Col. J. J. Graham (London: N. Trübner & Co., 1873). Public domain. Project Gutenberg #1946. https://www.gutenberg.org/ebooks/1946. Chapter-anchored mirror: https://clausewitzstudies.org/readings/OnWar1873/. Bk. III Ch. XI direct: https://clausewitzstudies.org/readings/OnWar1873/BK3ch11.html. Bk. VIII Ch. IV direct: https://clausewitzstudies.org/readings/OnWar1873/BK8ch04.html.
- Rumelt, Richard P. Good Strategy / Bad Strategy: The Difference and Why It Matters. New York: Crown Business, 2011. ISBN 978-0-307-88623-1. https://www.amazon.com/Good-Strategy-Bad-Difference-Matters/dp/0307886239.
- Hamel, Gary, and C. K. Prahalad. Competing for the Future. Boston: Harvard Business School Press, 1994. ISBN 978-0-87584-416-9. https://www.semanticscholar.org/paper/Competing-for-the-Future-Hamel-Prahalad/237784d5b853f51ac8e6e89a93327a5bcb2d53f5.
- Liddell Hart, B. H. Strategy. New York: Frederick A. Praeger, 1954. https://archive.org/details/strategy0000lidd.
- Articles 1–6 in this series — Strategy That Lasts: The Classics, May 2026, on inphronesys.com.
Leave a Reply